29
/
en
AIzaSyAYiBZKx7MnpbEhh9jyipgxe19OcubqV5w
April 1, 2024
81100
Belarus
BLR
true
2
1
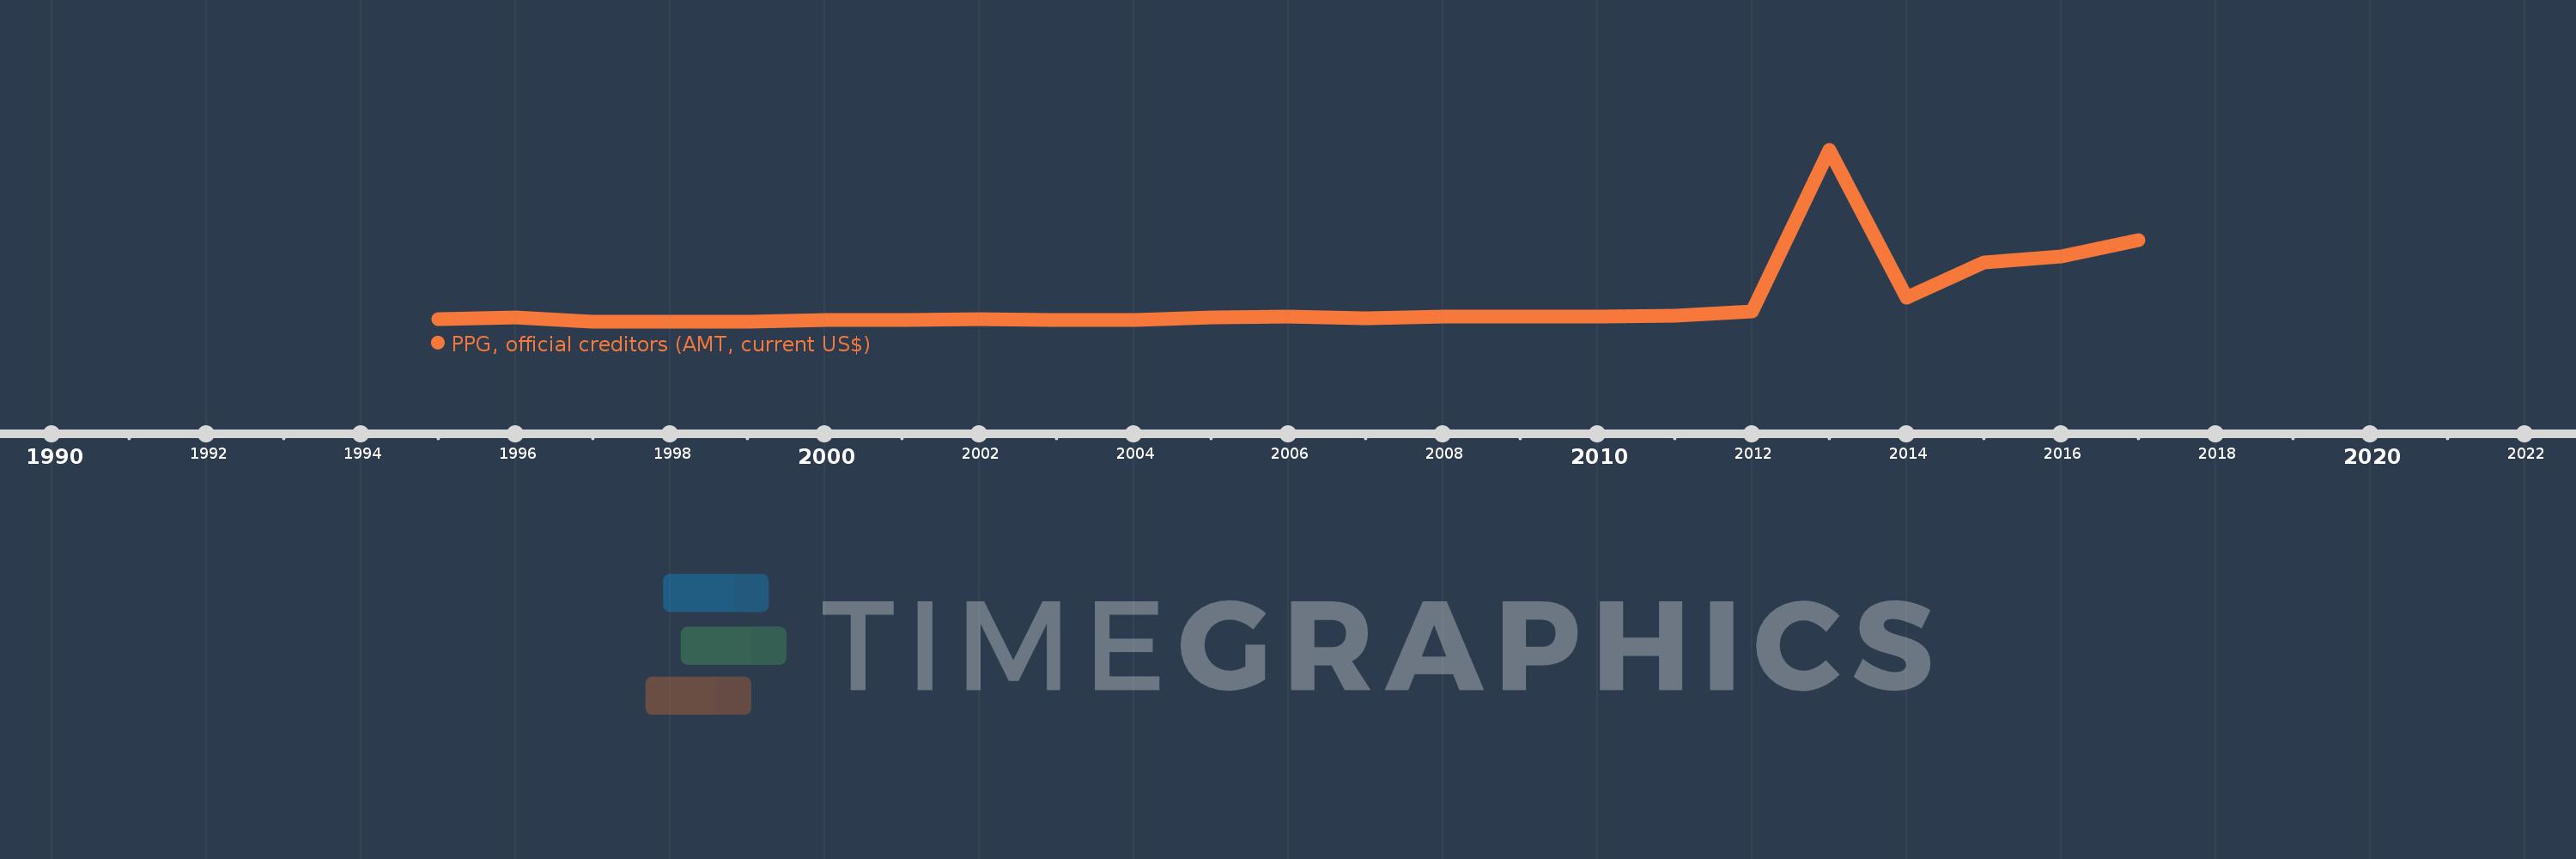
PPG, official creditors (AMT, current US$)
2017,2016,2015,2014,2013,2012,2011,2010,2009,2008,2007,2006,2005,2004,2003,2002,2001,2000,1999,1998,1997,1996,1995
This statistics in other country:
Timeline:
This timeline shows a graph from 1995 to 2017 of Belarus. No data until 1994. Number of actual observations by date: 23.
Source name:
World Development Indicators
Source organization:
World Bank, International Debt Statistics.
Categories, topics:
External Debt
Last updated:
apr 23, 2017
Indicators value changes by year
Minimum:
20.067 mln
jan 1, 1999
Maximum:
2.553 bln
jan 1, 2013
At the date of observation
Value
Absolute change
Change from previous value
jan 1, 1995
59.73 mln
+59.73 mln
0.0%
jan 1, 1996
84.057 mln
+24.327 mln
40.73%
jan 1, 1997
23.263 mln
-60.794 mln
-72.32%
jan 1, 1998
20.388 mln
-2.875 mln
-12.36%
jan 1, 1999
20.067 mln
-321.0K
-1.57%
jan 1, 2000
44.399 mln
+24.332 mln
121.25%
jan 1, 2001
52.44 mln
+8.041 mln
18.11%
jan 1, 2002
65.337 mln
+12.897 mln
24.59%
jan 1, 2003
54.925 mln
-10.412 mln
-15.94%
jan 1, 2004
44.901 mln
-10.024 mln
-18.25%
jan 1, 2005
86.676 mln
+41.775 mln
93.04%
jan 1, 2006
93.706 mln
+7.03 mln
8.11%
jan 1, 2007
73.217 mln
-20.489 mln
-21.87%
jan 1, 2008
97.989 mln
+24.772 mln
33.83%
jan 1, 2009
96.928 mln
-1.061 mln
-1.08%
jan 1, 2010
99.382 mln
+2.454 mln
2.53%
jan 1, 2011
109.864 mln
+10.482 mln
10.55%
jan 1, 2012
169.632 mln
+59.768 mln
54.4%
jan 1, 2013
2.553 bln
+2.383 bln
1.4K%
jan 1, 2014
379.013 mln
-2.174 bln
-85.15%
jan 1, 2015
892.595 mln
+513.582 mln
135.51%
jan 1, 2016
984.541 mln
+91.946 mln
10.3%
jan 1, 2017
1.232 bln
+247.128 mln
25.1%
Ranking of countries by current statistics by years


Comments: