30
/
AIzaSyAYiBZKx7MnpbEhh9jyipgxe19OcubqV5w
April 1, 2024
79729
Barbados
BRB
true
2
1
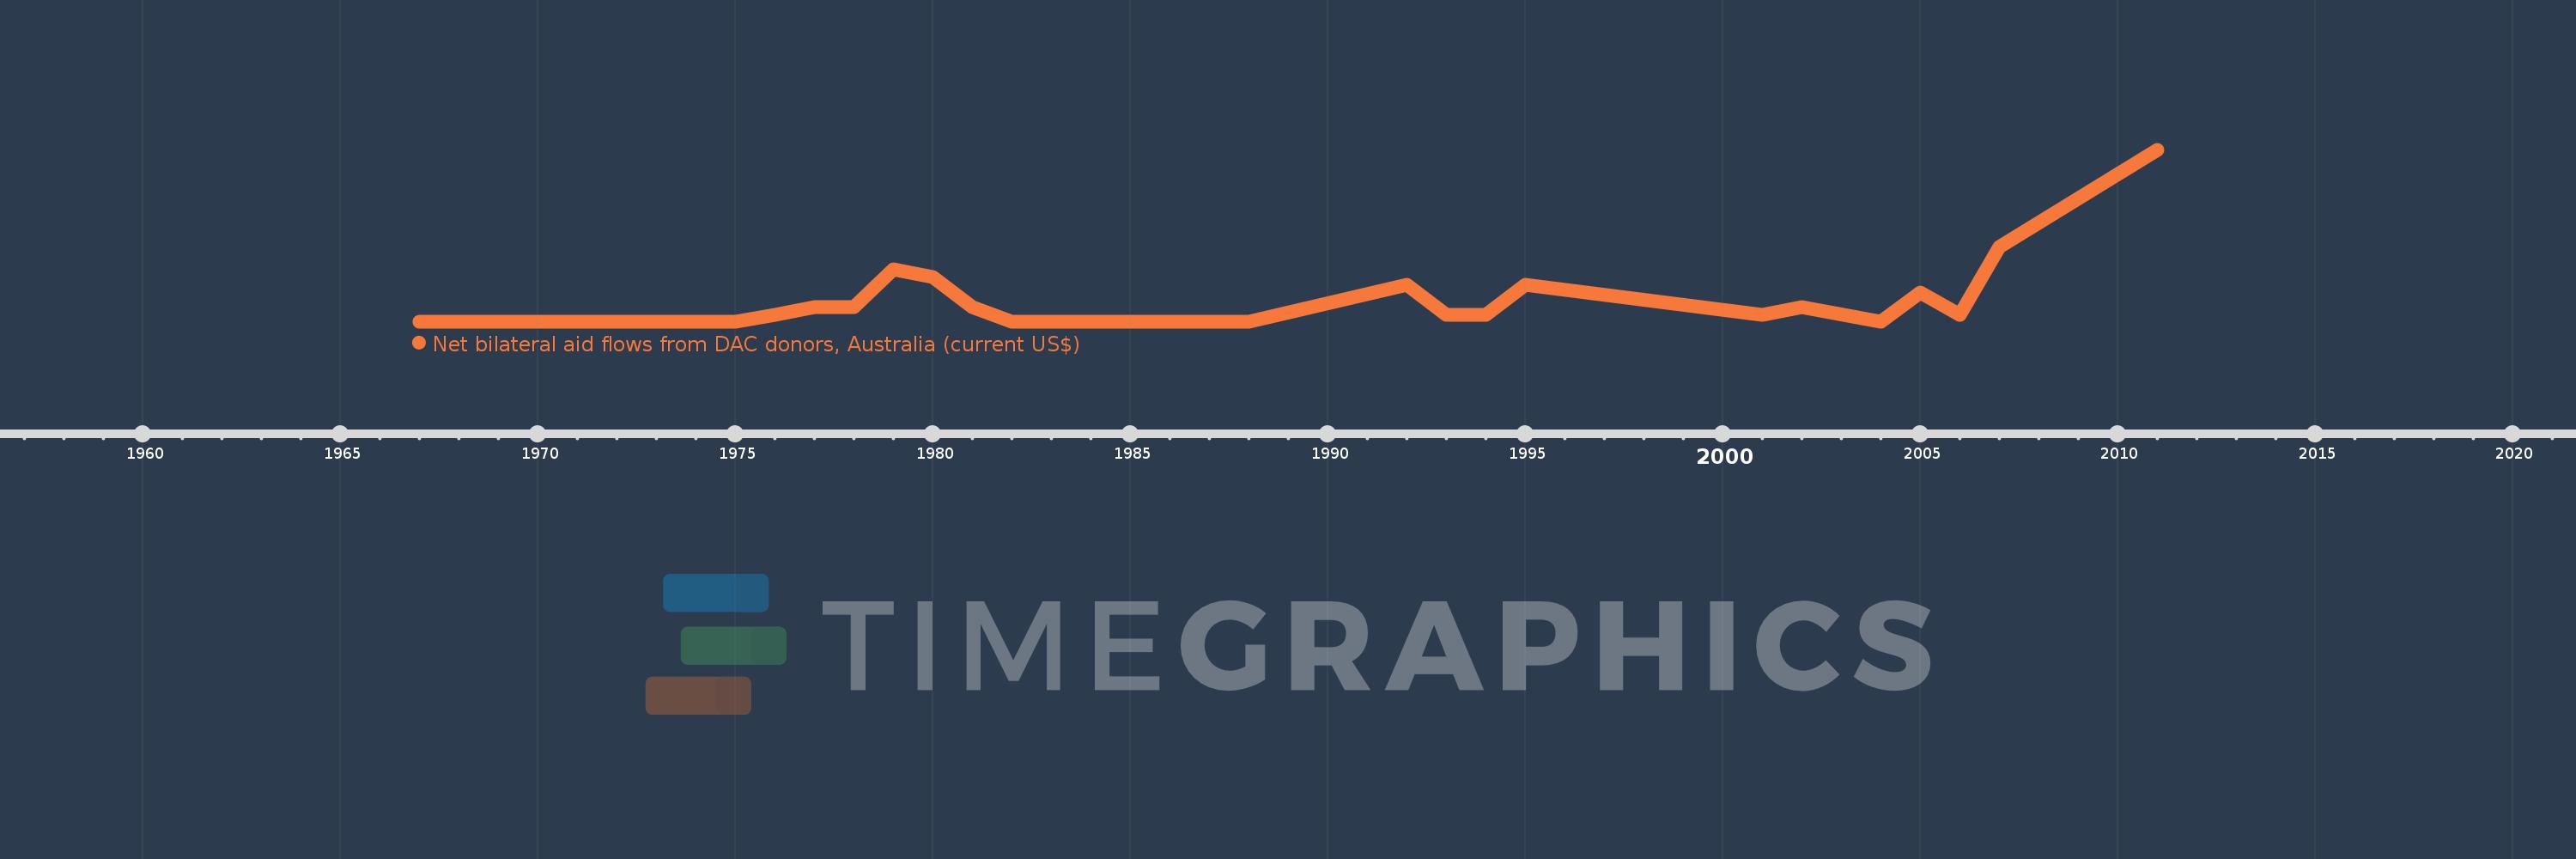
Net bilateral aid flows from DAC donors, Australia (current US$)
2011,2007,2006,2005,2004,2002,2001,1995,1994,1993,1992,1988,1987,1986,1982,1981,1980,1979,1978,1977,1976,1975,1974,1971,1969,1968,1967
