Download This statistics in other country:
Timeline:
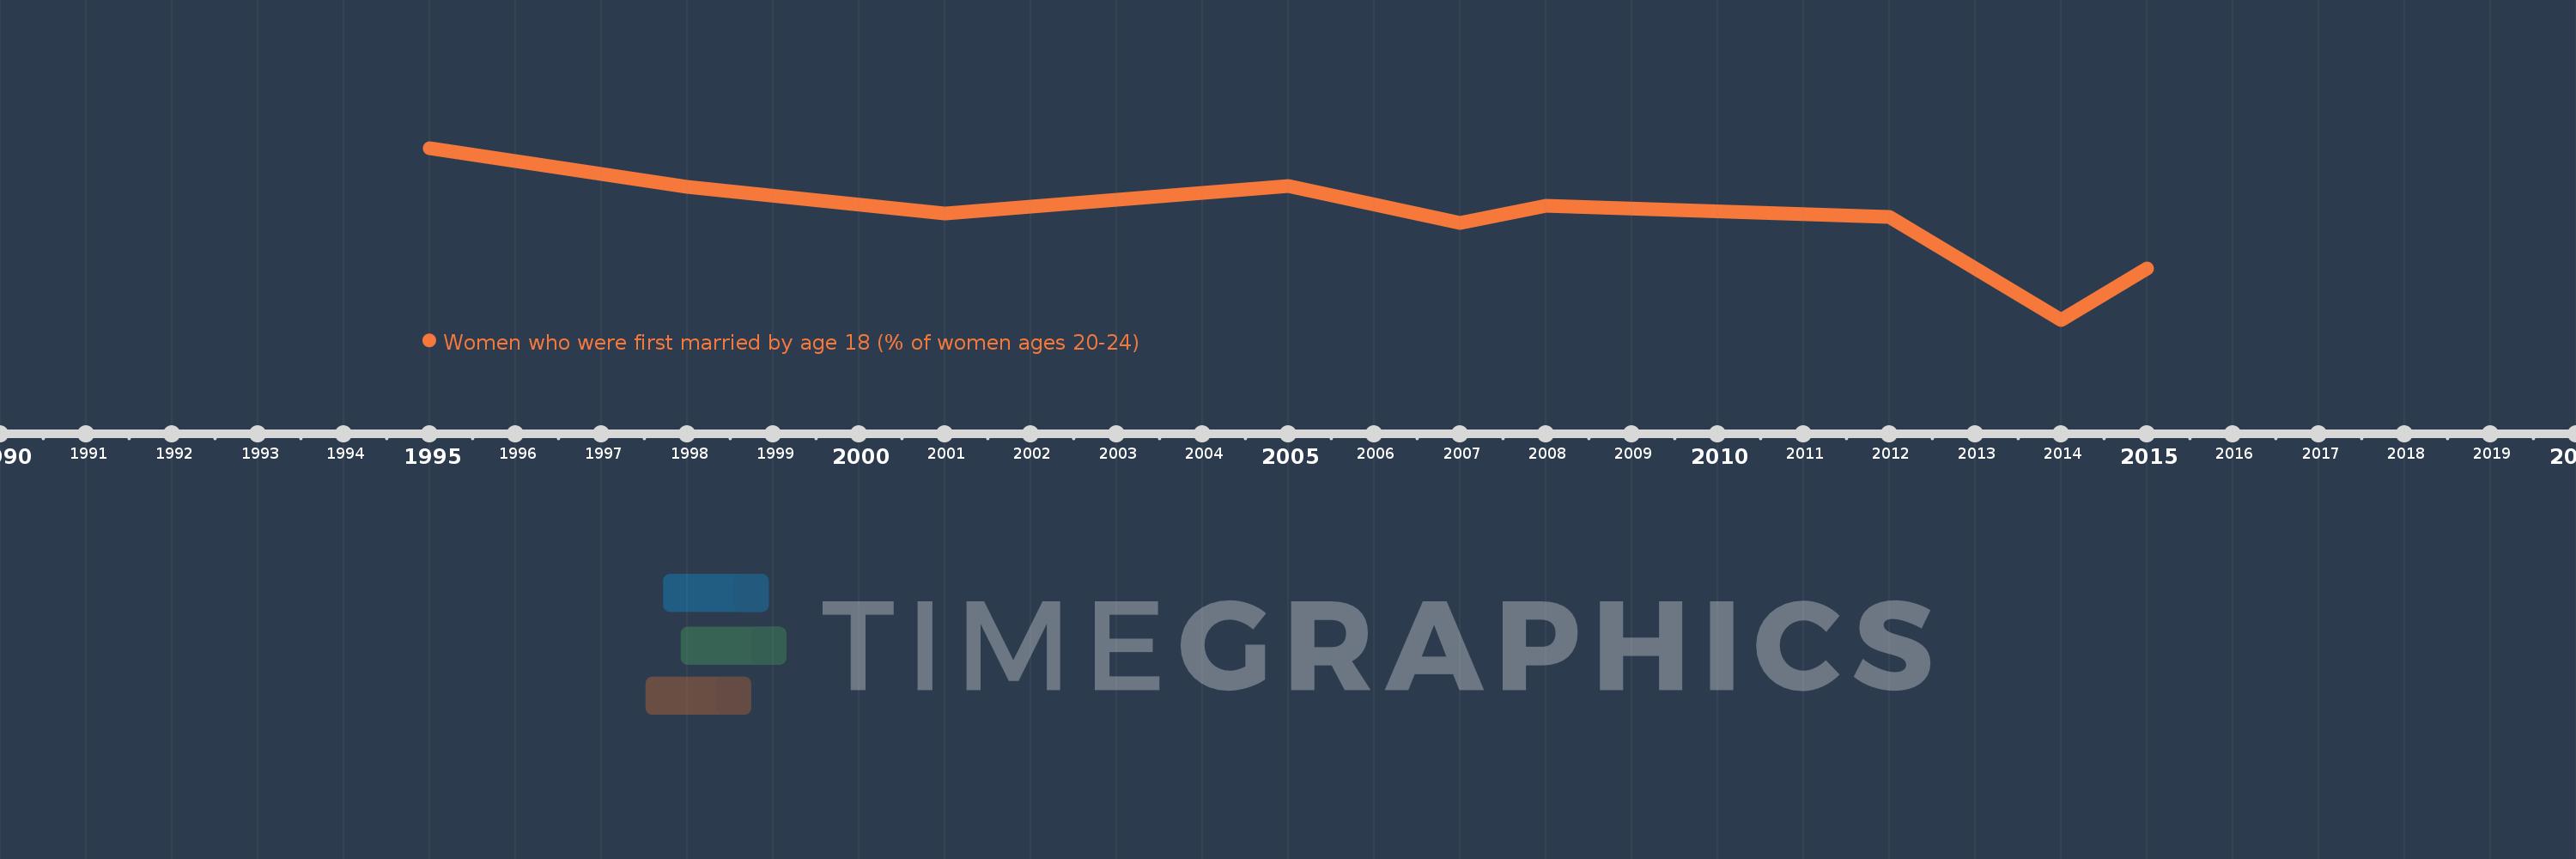
This timeline shows a graph from 1995 to 2015 of Bangladesh. No data until 1994. Number of actual observations by date: 9.
Source name:
World Development Indicators
Source organization:
Demographic and Health Surveys (DHS), Multiple Indicator Cluster Surveys (MICS), AIDS Indicator Surveys(AIS), Reproductive Health Survey(RHS), and other household surveys.
Categories, topics:
Health
Last updated:
apr 23, 2017
Indicators value changes by year
At the date of observation
Value
Absolute change
Change from the previous value
jan 1, 1995
73.3
+73.3
0.0%
jan 1, 1998
68.5
-4.8
-6.55%
jan 1, 2001
65.3
-3.2
-4.67%
jan 1, 2005
68.7
+3.4
5.21%
jan 1, 2007
64.1
-4.6
-6.7%
jan 1, 2008
66.2
+2.1
3.28%
jan 1, 2012
64.9
-1.3
-1.96%
jan 1, 2014
52.3
-12.6
-19.41%
jan 1, 2015
58.6
+6.3
12.05%
Ranking of countries by current statistics by years
