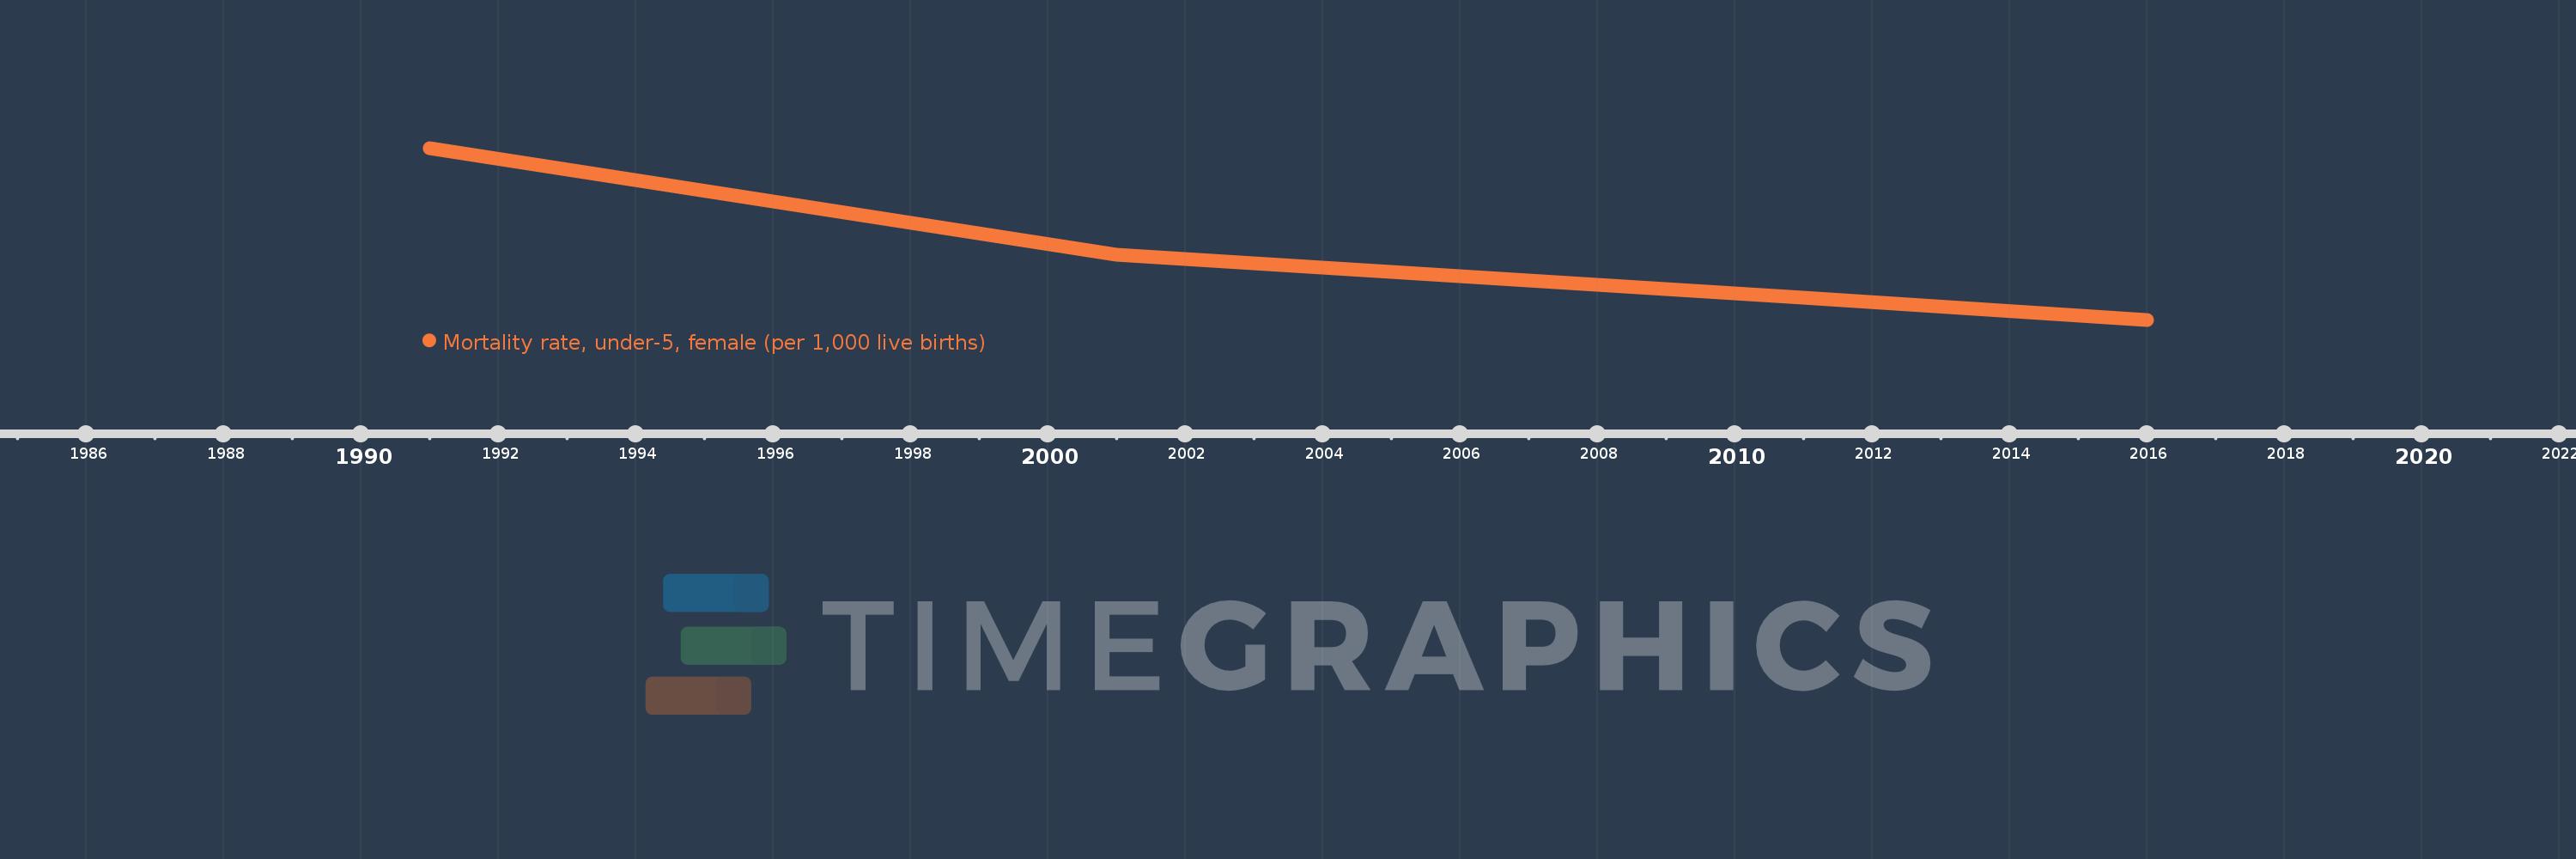
This timeline shows a graph from 1991 to 2016 of Bahrain. No data until 1990. Number of actual observations by date: 4.
Source name:
World Development Indicators
Source organization:
Estimates developed by the UN Inter-agency Group for Child Mortality Estimation (UNICEF, WHO, World Bank, UN DESA Population Division) at www.childmortality.org.
Categories, topics:
Health
Last updated:
apr 23, 2017
Indicators value changes by year
Meaning:
12.05
Minimum:
5.9
jan 1, 2016
Maximum:
22.2
jan 1, 1991
At the date of observation
Value
Absolute change
Change from the previous value
jan 1, 1991
22.2
+22.2
0.0%
jan 1, 2001
12.1
-10.1
-45.5%
jan 1, 2011
8.0
-4.1
-33.88%
jan 1, 2016
5.9
-2.1
-26.25%
Ranking of countries by current statistics by years
