29
/
en
AIzaSyAYiBZKx7MnpbEhh9jyipgxe19OcubqV5w
April 1, 2024
74806
Azerbaijan
AZE
true
2
1
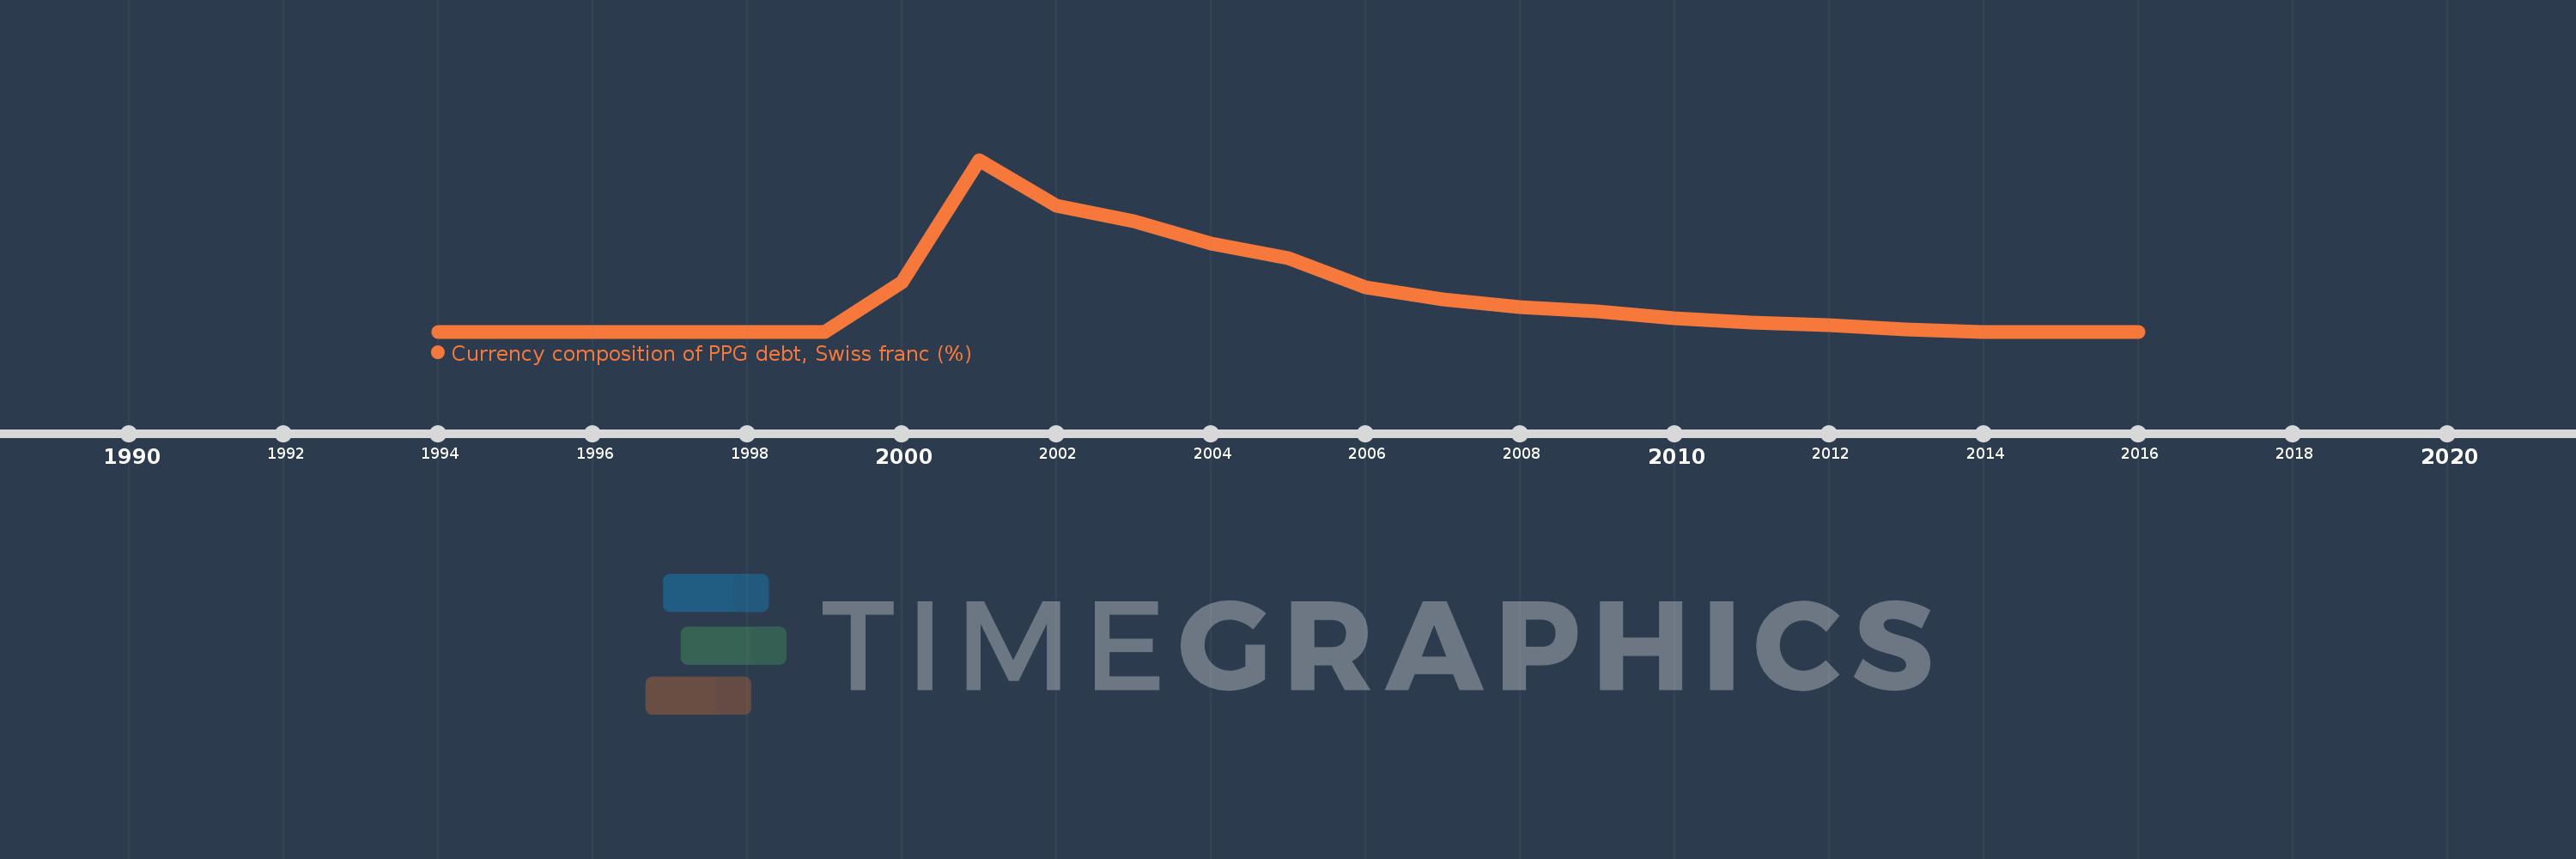
Currency composition of PPG debt, Swiss franc (%)
2016,2015,2014,2013,2012,2011,2010,2009,2008,2007,2006,2005,2004,2003,2002,2001,2000,1999,1998,1997,1996,1995,1994
This statistics in other country:
Timeline:
This timeline shows a graph from 1994 to 2016 of Azerbaijan. No data until 1993. Number of actual observations by date: 23.
Source name:
World Development Indicators
Source organization:
World Bank, International Debt Statistics.
Categories, topics:
External Debt
Last updated:
apr 23, 2017
Indicators value changes by year
Maximum:
12.066
jan 1, 2001
At the date of observation
Value
Absolute change
Change from previous value
jan 1, 2000
3.495
+3.495
%
jan 1, 2001
12.066
+8.571
245.23%
jan 1, 2002
8.844
-3.222
-26.7%
jan 1, 2003
7.78
-1.064
-12.03%
jan 1, 2004
6.181
-1.599
-20.55%
jan 1, 2005
5.152
-1.029
-16.65%
jan 1, 2006
3.107
-2.045
-39.69%
jan 1, 2007
2.241
-0.866
-27.88%
jan 1, 2008
1.701
-0.54
-24.09%
jan 1, 2009
1.413
-0.288
-16.92%
jan 1, 2010
0.953
-0.461
-32.6%
jan 1, 2011
0.617
-0.336
-35.26%
jan 1, 2012
0.424
-0.193
-31.25%
jan 1, 2013
0.165
-0.259
-61.13%
jan 1, 2014
0.0
-0.165
-100.0%
Ranking of countries by current statistics by years


Comments: