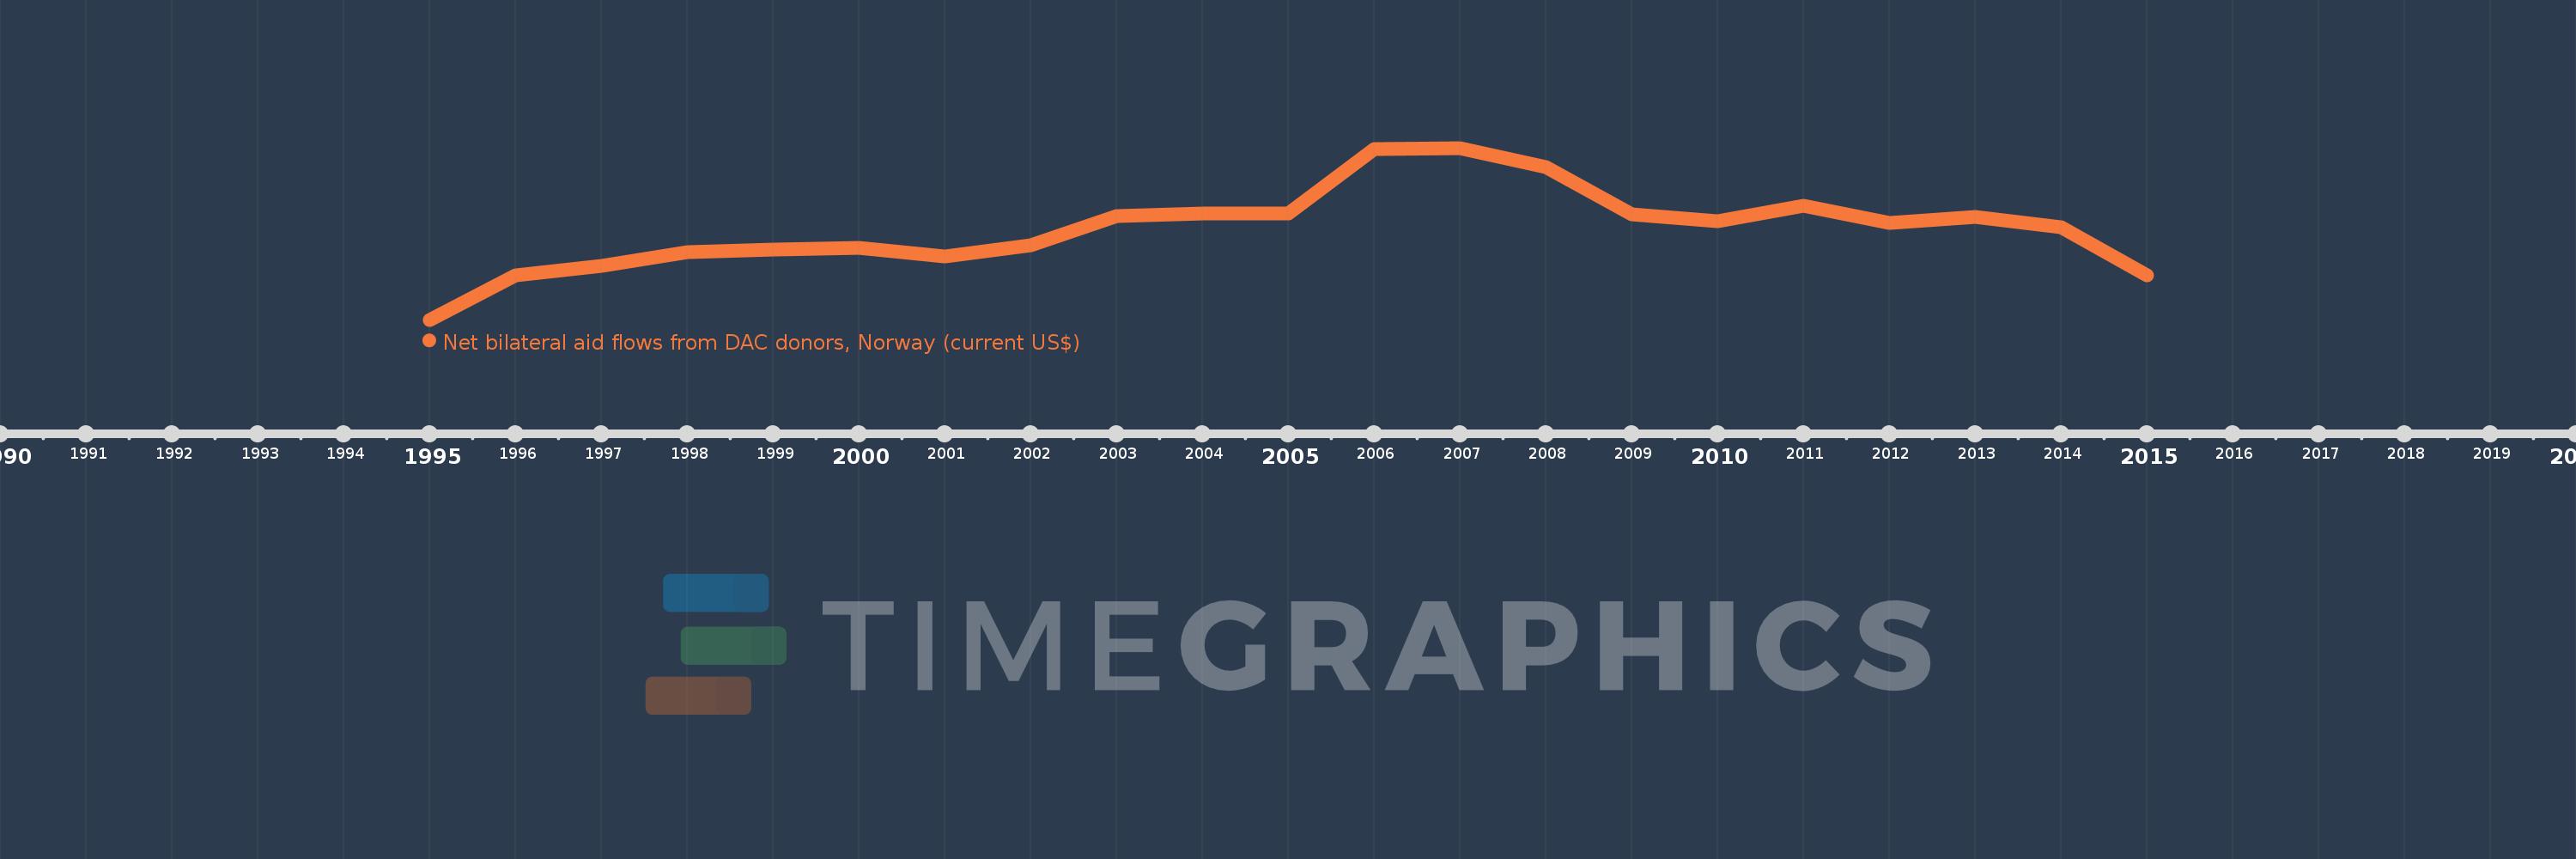
This timeline shows a graph from 1995 to 2015 of Armenia. No data until 1994. Number of actual observations by date: 21.
Source name:
World Development Indicators
Source organization:
Development Assistance Committee of the Organisation for Economic Co-operation and Development, Geographical Distribution of Financial Flows to Developing Countries, Development Co-operation Report, and International Development Statistics database. Data are available online at: www.oecd.org/dac/stats/idsonline.
Categories, topics:
Aid Effectiveness
Last updated:
apr 23, 2017
Indicators value changes by year
Meaning:
2.905 mln
Minimum:
300.0K
jan 1, 1995
Maximum:
5.22 mln
jan 1, 2007
At the date of observation
Value
Absolute change
Change from the previous value
jan 1, 1995
300.0K
+300.0K
0.0%
jan 1, 1996
1.58 mln
+1.28 mln
426.67%
jan 1, 1997
1.84 mln
+260.0K
16.46%
jan 1, 1998
2.23 mln
+390.0K
21.2%
jan 1, 1999
2.31 mln
+80.0K
3.59%
jan 1, 2000
2.35 mln
+40.0K
1.73%
jan 1, 2001
2.11 mln
-240.0K
-10.21%
jan 1, 2002
2.43 mln
+320.0K
15.17%
jan 1, 2003
3.28 mln
+850.0K
34.98%
jan 1, 2004
3.35 mln
+70.0K
2.13%
jan 1, 2005
3.34 mln
-10.0K
-0.3%
jan 1, 2006
5.18 mln
+1.84 mln
55.09%
jan 1, 2007
5.22 mln
+40.0K
0.77%
jan 1, 2008
4.66 mln
-560.0K
-10.73%
jan 1, 2009
3.31 mln
-1.35 mln
-28.97%
jan 1, 2010
3.12 mln
-190.0K
-5.74%
jan 1, 2011
3.57 mln
+450.0K
14.42%
jan 1, 2012
3.07 mln
-500.0K
-14.01%
jan 1, 2013
3.25 mln
+180.0K
5.86%
jan 1, 2014
2.95 mln
-300.0K
-9.23%
jan 1, 2015
1.56 mln
-1.39 mln
-47.12%
Ranking of countries by current statistics by years
