29
/
en
AIzaSyAYiBZKx7MnpbEhh9jyipgxe19OcubqV5w
April 1, 2024
67857
Angola
AGO
true
2
1
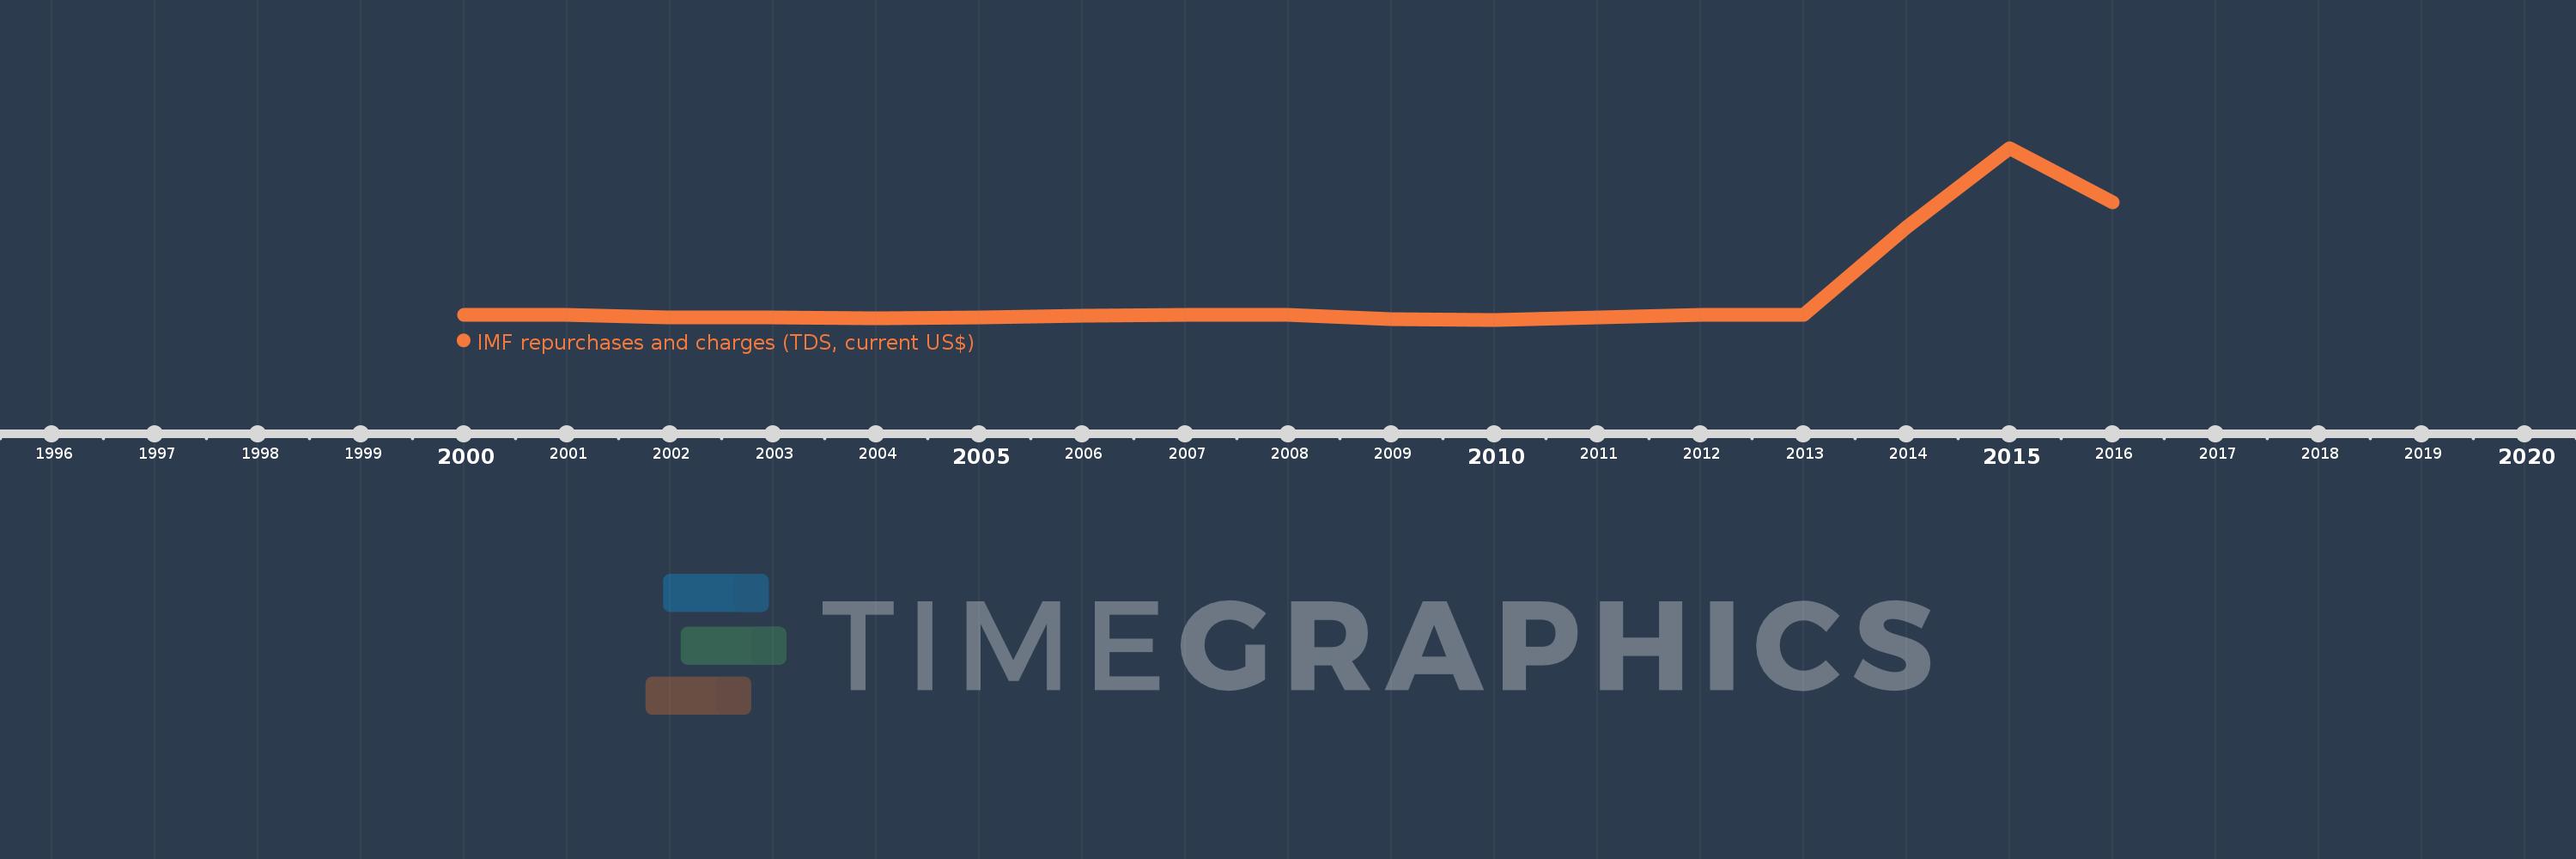
IMF repurchases and charges (TDS, current US$)
2016,2015,2014,2013,2012,2011,2010,2009,2008,2007,2006,2005,2004,2003,2002,2001,2000
This statistics in other country:
Timeline:
This timeline shows a graph from 2000 to 2016 of Angola. No data until 1999. Number of actual observations by date: 17.
Source name:
World Development Indicators
Source organization:
World Bank, International Debt Statistics.
Categories, topics:
External Debt
Last updated:
apr 23, 2017
Indicators value changes by year
Minimum:
984.0K
jan 1, 2010
Maximum:
510.409 mln
jan 1, 2015
At the date of observation
Value
Absolute change
Change from previous value
jan 1, 2000
14.41 mln
+14.41 mln
0.0%
jan 1, 2001
15.628 mln
+1.218 mln
8.45%
jan 1, 2002
7.751 mln
-7.877 mln
-50.4%
jan 1, 2003
6.752 mln
-999.0K
-12.89%
jan 1, 2004
5.996 mln
-756.0K
-11.2%
jan 1, 2005
8.982 mln
+2.986 mln
49.8%
jan 1, 2006
12.221 mln
+3.239 mln
36.06%
jan 1, 2007
16.349 mln
+4.128 mln
33.78%
jan 1, 2008
14.294 mln
-2.055 mln
-12.57%
jan 1, 2009
3.539 mln
-10.755 mln
-75.24%
jan 1, 2010
984.0K
-2.555 mln
-72.2%
jan 1, 2011
6.98 mln
+5.996 mln
609.35%
jan 1, 2012
15.405 mln
+8.425 mln
120.7%
jan 1, 2013
14.24 mln
-1.165 mln
-7.56%
jan 1, 2014
276.044 mln
+261.804 mln
1.84K%
jan 1, 2015
510.409 mln
+234.365 mln
84.9%
jan 1, 2016
349.732 mln
-160.677 mln
-31.48%
Ranking of countries by current statistics by years


Comments: