29
/
en
AIzaSyAYiBZKx7MnpbEhh9jyipgxe19OcubqV5w
April 1, 2024
66113
Algeria
DZA
true
2
1
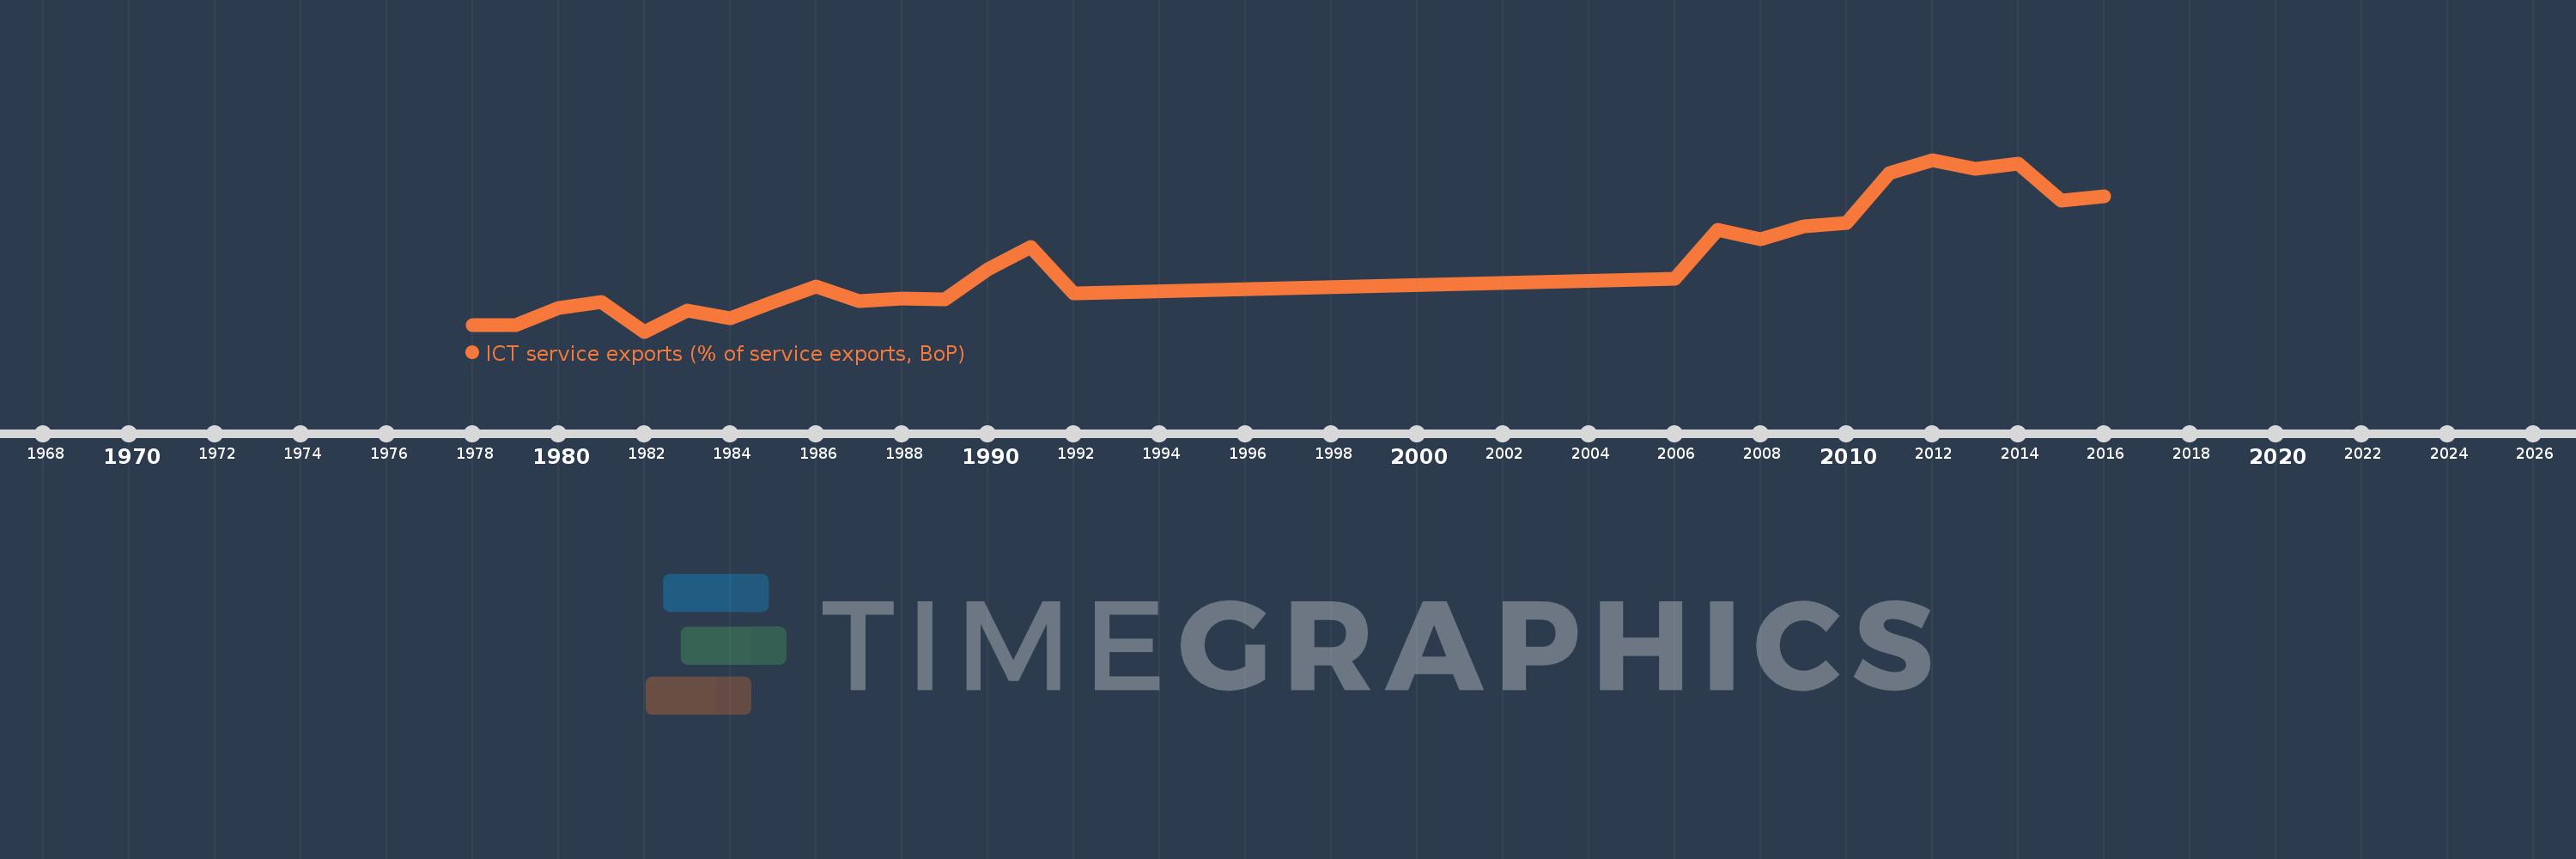
ICT service exports (% of service exports, BoP)
2016,2015,2014,2013,2012,2011,2010,2009,2008,2007,2006,1992,1991,1990,1989,1988,1987,1986,1985,1984,1983,1982,1981,1980,1979,1978
This statistics in other country:
AfghanistanAlbaniaAlgeriaAngolaAntigua and BarbudaArgentinaArmeniaArubaAustraliaAustriaAzerbaijanBahrainBangladeshBarbadosBelarusBelgiumBelizeBeninBermudaBhutanBoliviaBosnia and HerzegovinaBotswanaBrazilBrunei DarussalamBulgariaBurkina FasoBurundiCabo VerdeCambodiaCameroonCanadaCaribbean small statesCentral Europe and the BalticsChileChinaColombiaComorosCongo, Dem. Rep.Congo, Rep.Costa RicaCote d'IvoireCroatiaCuracaoCyprusCzech RepublicDenmarkDjiboutiDominicaDominican RepublicEarly-demographic dividendEast Asia & PacificEast Asia & Pacific (excluding high income)East Asia & Pacific (IDA & IBRD countries)EcuadorEgypt, Arab Rep.El SalvadorEritreaEstoniaEthiopiaEuro areaEurope & Central AsiaEurope & Central Asia (excluding high income)Europe & Central Asia (IDA & IBRD countries)European UnionFaroe IslandsFijiFinlandFranceFrench PolynesiaGabonGambia, TheGeorgiaGermanyGreeceGrenadaGuatemalaGuineaGuinea-BissauGuyanaHeavily indebted poor countries (HIPC)High incomeHondurasHong Kong SAR, ChinaHungaryIBRD onlyIcelandIDA & IBRD totalIDA onlyIndiaIndonesiaIraqIrelandIsraelItalyJamaicaJapanJordanKazakhstanKenyaKorea, Rep.KosovoKuwaitKyrgyz RepublicLao PDRLate-demographic dividendLatin America & Caribbean Latin America & Caribbean (excluding high income)Latin America & the Caribbean (IDA & IBRD countries)LatviaLeast developed countries: UN classificationLebanonLesothoLithuaniaLow & middle incomeLow incomeLower middle incomeLuxembourgMacao SAR, ChinaMacedonia, FYRMadagascarMalawiMalaysiaMaliMaltaMauritaniaMauritiusMexicoMicronesia, Fed. Sts.Middle incomeMoldovaMongoliaMontenegroMoroccoMozambiqueMyanmarNamibiaNepalNetherlandsNew CaledoniaNew ZealandNicaraguaNigerNigeriaNorth AmericaNorwayOECD membersOmanPacific island small statesPakistanPalauPanamaPapua New GuineaParaguayPeruPhilippinesPolandPortugalPost-demographic dividendPre-demographic dividendRomaniaRussian FederationRwandaSamoaSao Tome and PrincipeSaudi ArabiaSenegalSerbiaSeychellesSierra LeoneSingaporeSint Maarten (Dutch part)Slovak RepublicSloveniaSolomon IslandsSouth AfricaSouth AsiaSouth Asia (IDA & IBRD)South SudanSpainSri LankaSt. Kitts and NevisSt. LuciaSt. Vincent and the GrenadinesSub-Saharan Africa Sub-Saharan Africa (excluding high income)Sub-Saharan Africa (IDA & IBRD countries)SudanSurinameSwazilandSwedenSwitzerlandSyrian Arab RepublicTajikistanTanzaniaThailandTogoTongaTrinidad and TobagoTunisiaTurkeyTuvaluUgandaUkraineUnited KingdomUnited StatesUpper middle incomeUruguayVanuatuVenezuela, RBWest Bank and GazaWorldYemen, Rep.ZambiaZimbabwe Timeline:
This timeline shows a graph from 1978 to 2016 of Algeria. No data until 1977. Number of actual observations by date: 26.
Source name:
World Development Indicators
Source organization:
International Monetary Fund, Balance of Payments Statistics Yearbook and data files.
Categories, topics:
Economy & Growth, Infrastructure, Trade
Last updated:
apr 23, 2017
Indicators value changes by year
Minimum:
15.599
jan 1, 1982
Maximum:
60.207
jan 1, 2012
At the date of observation
Value
Absolute change
Change from previous value
jan 1, 1978
17.267
+17.267
0.0%
jan 1, 1979
17.26
-0.007
-0.04%
jan 1, 1980
21.84
+4.58
26.54%
jan 1, 1981
23.195
+1.354
6.2%
jan 1, 1982
15.599
-7.596
-32.75%
jan 1, 1983
21.155
+5.556
35.62%
jan 1, 1984
19.121
-2.034
-9.61%
jan 1, 1985
23.19
+4.07
21.28%
jan 1, 1986
27.283
+4.093
17.65%
jan 1, 1987
23.616
-3.667
-13.44%
jan 1, 1988
24.143
+0.527
2.23%
jan 1, 1989
23.868
-0.275
-1.14%
jan 1, 1990
31.866
+7.999
33.51%
jan 1, 1991
37.489
+5.622
17.64%
jan 1, 1992
25.589
-11.9
-31.74%
jan 1, 2006
29.238
+3.649
14.26%
jan 1, 2007
42.044
+12.806
43.8%
jan 1, 2008
39.509
-2.534
-6.03%
jan 1, 2009
43.001
+3.492
8.84%
jan 1, 2010
43.708
+0.707
1.64%
jan 1, 2011
56.653
+12.945
29.62%
jan 1, 2012
60.207
+3.554
6.27%
jan 1, 2013
57.862
-2.345
-3.89%
jan 1, 2014
59.238
+1.376
2.38%
jan 1, 2015
49.559
-9.679
-16.34%
jan 1, 2016
50.666
+1.107
2.23%
Ranking of countries by current statistics by years


Comments: