29
/
en
AIzaSyAYiBZKx7MnpbEhh9jyipgxe19OcubqV5w
April 1, 2024
62855
World
WLD
false
2
1
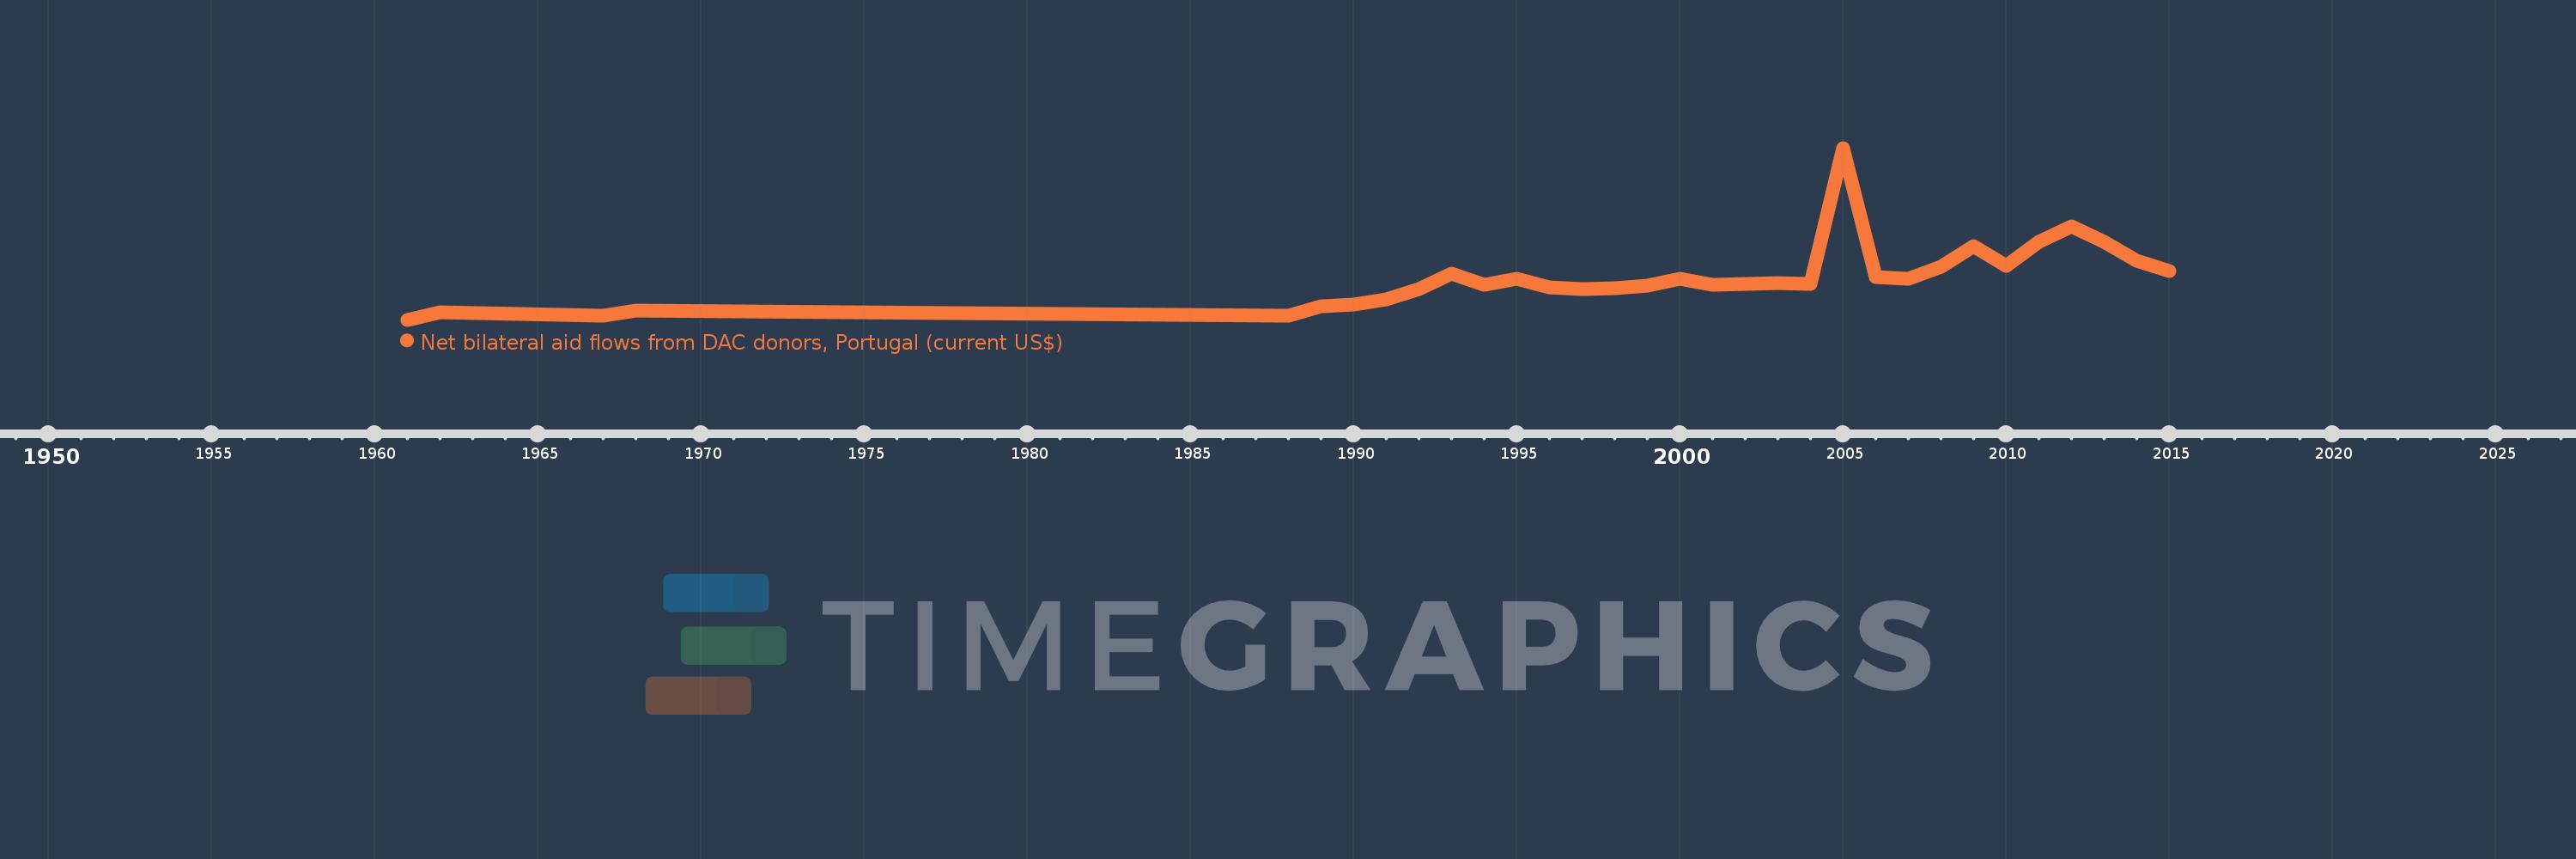
Net bilateral aid flows from DAC donors, Portugal (current US$)
2015,2014,2013,2012,2011,2010,2009,2008,2007,2006,2005,2004,2003,2002,2001,2000,1999,1998,1997,1996,1995,1994,1993,1992,1991,1990,1989,1988,1968,1967,1962,1961
This statistics in other country:
AfghanistanAlbaniaAlgeriaAngolaArab WorldArgentinaArmeniaBelarusBeninBoliviaBosnia and HerzegovinaBotswanaBrazilBulgariaBurundiCabo VerdeCambodiaCameroonCaribbean small statesCentral African RepublicCentral Europe and the BalticsChadChileChinaColombiaComorosCongo, Dem. Rep.Congo, Rep.Costa RicaCote d'IvoireCroatiaCubaCyprusCzech RepublicDominican RepublicEast Asia & PacificEast Asia & Pacific (excluding high income)East Asia & Pacific (IDA & IBRD countries)EcuadorEgypt, Arab Rep.El SalvadorEquatorial GuineaEritreaEstoniaEthiopiaEuro areaEurope & Central AsiaEurope & Central Asia (excluding high income)Europe & Central Asia (IDA & IBRD countries)European UnionFragile and conflict affected situationsGabonGambia, TheGeorgiaGhanaGuatemalaGuineaGuinea-BissauHaitiHeavily indebted poor countries (HIPC)High incomeHondurasHungaryIBRD onlyIDA & IBRD totalIDA blendIDA onlyIDA totalIndiaIndonesiaIran, Islamic Rep.IraqIsraelJamaicaJordanKazakhstanKenyaKorea, Dem. People’s Rep.Korea, Rep.KosovoKyrgyz RepublicLao PDRLatin America & Caribbean Latin America & Caribbean (excluding high income)Latin America & the Caribbean (IDA & IBRD countries)LatviaLeast developed countries: UN classificationLebanonLiberiaLibyaLow & middle incomeLow incomeLower middle incomeMacao SAR, ChinaMacedonia, FYRMadagascarMalawiMalaysiaMaldivesMaliMauritaniaMexicoMiddle East & North AfricaMiddle East & North Africa (excluding high income)Middle East & North Africa (IDA & IBRD countries)Middle incomeMoldovaMontenegroMoroccoMozambiqueMyanmarNamibiaNepalNicaraguaNigerNigeriaOECD membersOther small statesPacific island small statesPakistanPanamaParaguayPeruPhilippinesPolandRomaniaRussian FederationRwandaSao Tome and PrincipeSenegalSerbiaSeychellesSierra LeoneSlovak RepublicSloveniaSmall statesSolomon IslandsSomaliaSouth AfricaSouth AsiaSouth Asia (IDA & IBRD)Sri LankaSt. LuciaSt. Vincent and the GrenadinesSub-Saharan Africa Sub-Saharan Africa (excluding high income)Sub-Saharan Africa (IDA & IBRD countries)SudanSurinameSwazilandSyrian Arab RepublicTajikistanTanzaniaThailandTimor-LesteTogoTunisiaTurkeyUkraineUpper middle incomeUruguayVenezuela, RBVietnamWest Bank and GazaWorldZambiaZimbabwe Timeline:
This timeline shows a graph from 1961 to 2015 of World. No data until 1960. Number of actual observations by date: 32.
Source name:
World Development Indicators
Source organization:
Development Assistance Committee of the Organisation for Economic Co-operation and Development, Geographical Distribution of Financial Flows to Developing Countries, Development Co-operation Report, and International Development Statistics database. Data are available online at: www.oecd.org/dac/stats/idsonline.
Categories, topics:
Aid Effectiveness
Last updated:
apr 23, 2017
Indicators value changes by year
Minimum:
1.08 mln
jan 1, 1961
Maximum:
873.85 mln
jan 1, 2005
At the date of observation
Value
Absolute change
Change from previous value
jan 1, 1961
1.08 mln
+1.08 mln
0.0%
jan 1, 1962
37.8 mln
+36.72 mln
3.4K%
jan 1, 1967
20.67 mln
-17.13 mln
-45.32%
jan 1, 1968
46.4 mln
+25.73 mln
124.48%
jan 1, 1988
22.3 mln
-24.1 mln
-51.94%
jan 1, 1989
70.0 mln
+47.7 mln
213.9%
jan 1, 1990
78.36 mln
+8.36 mln
11.94%
jan 1, 1991
103.31 mln
+24.95 mln
31.84%
jan 1, 1992
158.38 mln
+55.07 mln
53.31%
jan 1, 1993
233.3 mln
+74.92 mln
47.3%
jan 1, 1994
178.21 mln
-55.09 mln
-23.61%
jan 1, 1995
210.09 mln
+31.88 mln
17.89%
jan 1, 1996
165.34 mln
-44.75 mln
-21.3%
jan 1, 1997
157.43 mln
-7.91 mln
-4.78%
jan 1, 1998
163.41 mln
+5.98 mln
3.8%
jan 1, 1999
176.42 mln
+13.01 mln
7.96%
jan 1, 2000
207.46 mln
+31.04 mln
17.59%
jan 1, 2001
179.15 mln
-28.31 mln
-13.65%
jan 1, 2002
184.08 mln
+4.93 mln
2.75%
jan 1, 2003
187.15 mln
+3.07 mln
1.67%
jan 1, 2004
182.85 mln
-4.3 mln
-2.3%
jan 1, 2005
873.85 mln
+691.0 mln
377.91%
jan 1, 2006
218.3 mln
-655.55 mln
-75.02%
jan 1, 2007
211.29 mln
-7.01 mln
-3.21%
jan 1, 2008
270.17 mln
+58.88 mln
27.87%
jan 1, 2009
373.41 mln
+103.24 mln
38.21%
jan 1, 2010
276.58 mln
-96.83 mln
-25.93%
jan 1, 2011
396.07 mln
+119.49 mln
43.2%
jan 1, 2012
477.13 mln
+81.06 mln
20.47%
jan 1, 2013
397.24 mln
-79.89 mln
-16.74%
jan 1, 2014
302.76 mln
-94.48 mln
-23.78%
jan 1, 2015
246.38 mln
-56.38 mln
-18.62%
Ranking of countries by current statistics by years


Comments: