29
/
en
AIzaSyAYiBZKx7MnpbEhh9jyipgxe19OcubqV5w
April 1, 2024
61471
Upper middle income
UMC
false
2
1
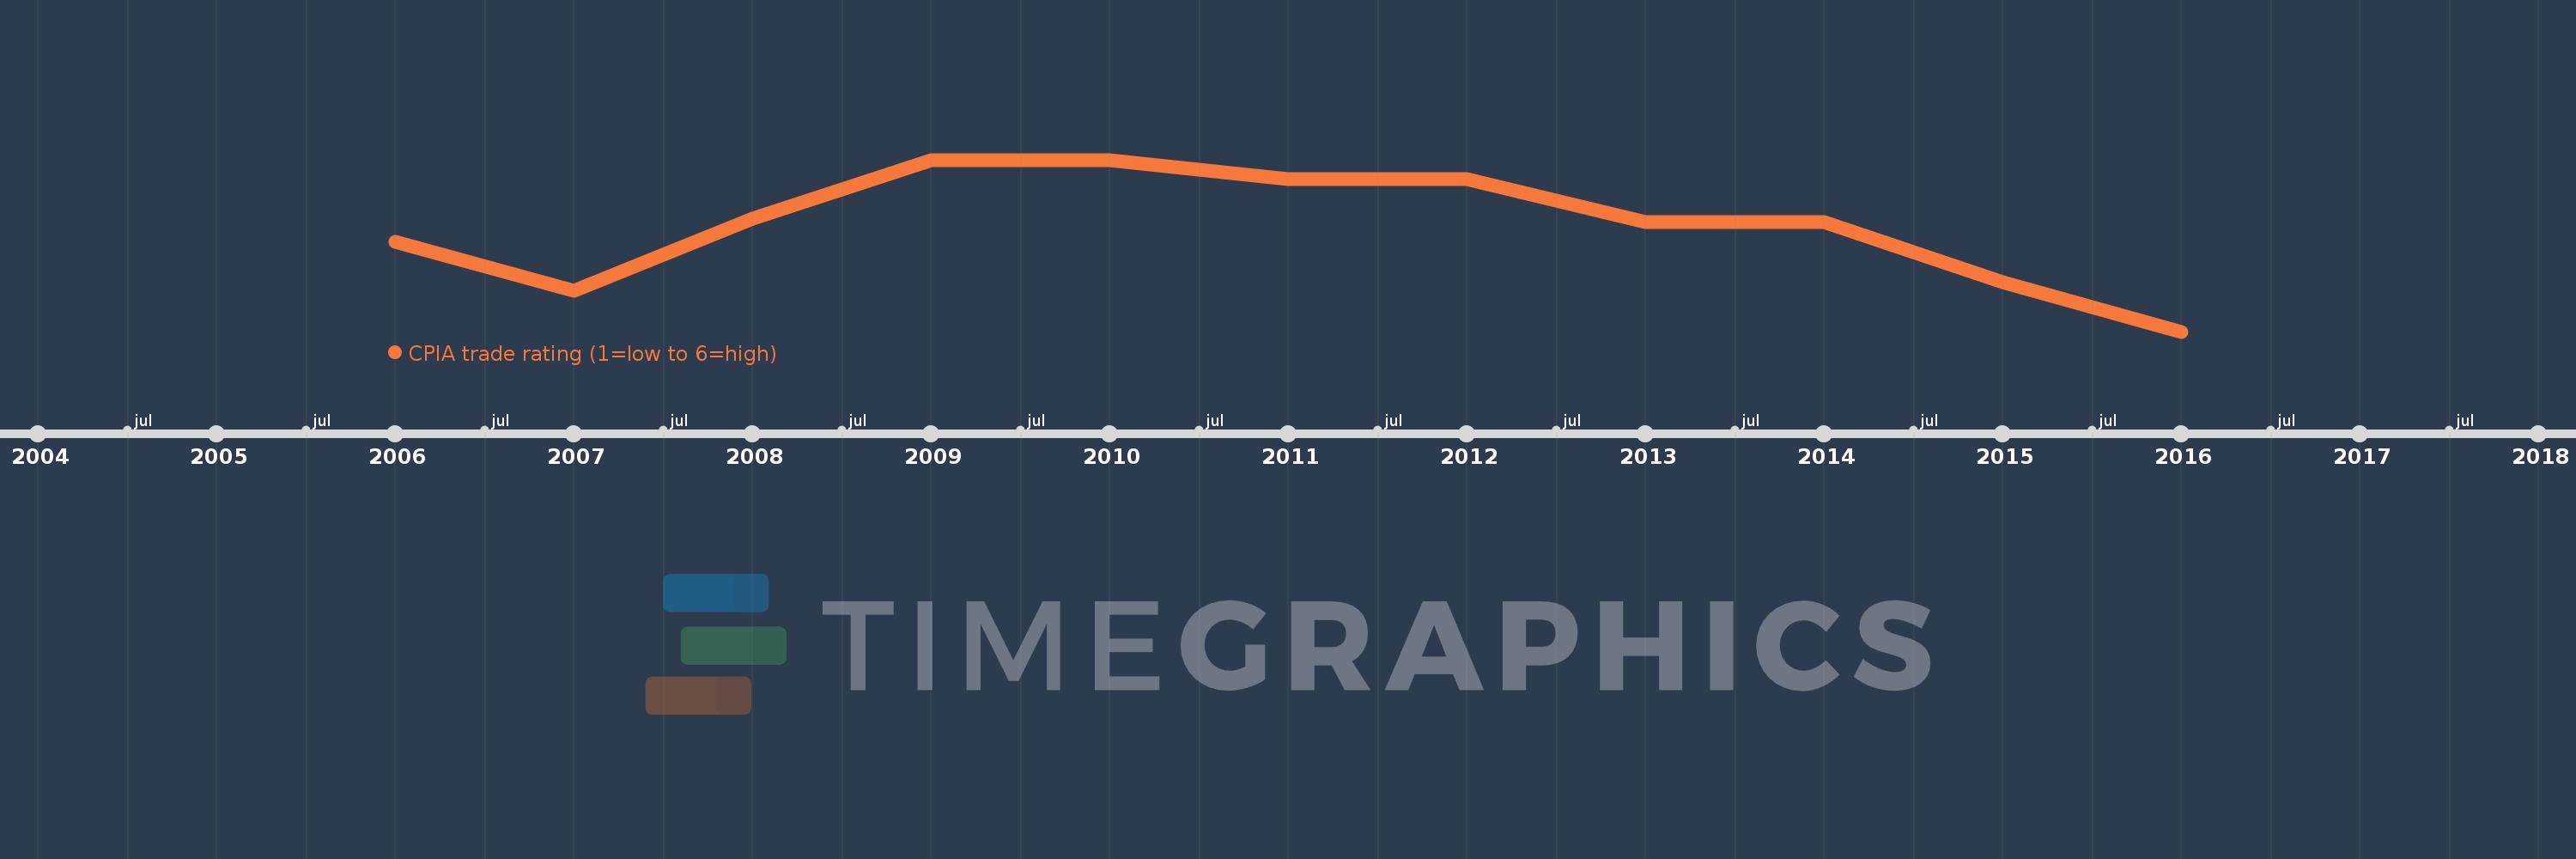
CPIA trade rating (1=low to 6=high)
2016,2015,2014,2013,2012,2011,2010,2009,2008,2007,2006
This statistics in other country:
Timeline:
This timeline shows a graph from 2006 to 2016 of Upper middle income. No data until 2005. Number of actual observations by date: 11.
Source name:
World Development Indicators
Source organization:
World Bank Group, CPIA database (http://www.worldbank.org/ida).
Categories, topics:
Public Sector
Last updated:
apr 23, 2017
Indicators value changes by year
At the date of observation
Value
Absolute change
Change from previous value
jan 1, 2006
4.042
+4.042
0.0%
jan 1, 2007
3.917
-0.125
-3.09%
jan 1, 2008
4.1
+0.183
4.68%
jan 1, 2009
4.25
+0.15
3.66%
jan 1, 2011
4.2
-0.05
-1.18%
jan 1, 2013
4.091
-0.109
-2.6%
jan 1, 2014
4.091
0.0
0.0%
jan 1, 2015
3.938
-0.153
-3.75%
jan 1, 2016
3.813
-0.125
-3.17%
Ranking of countries by current statistics by years


Comments: