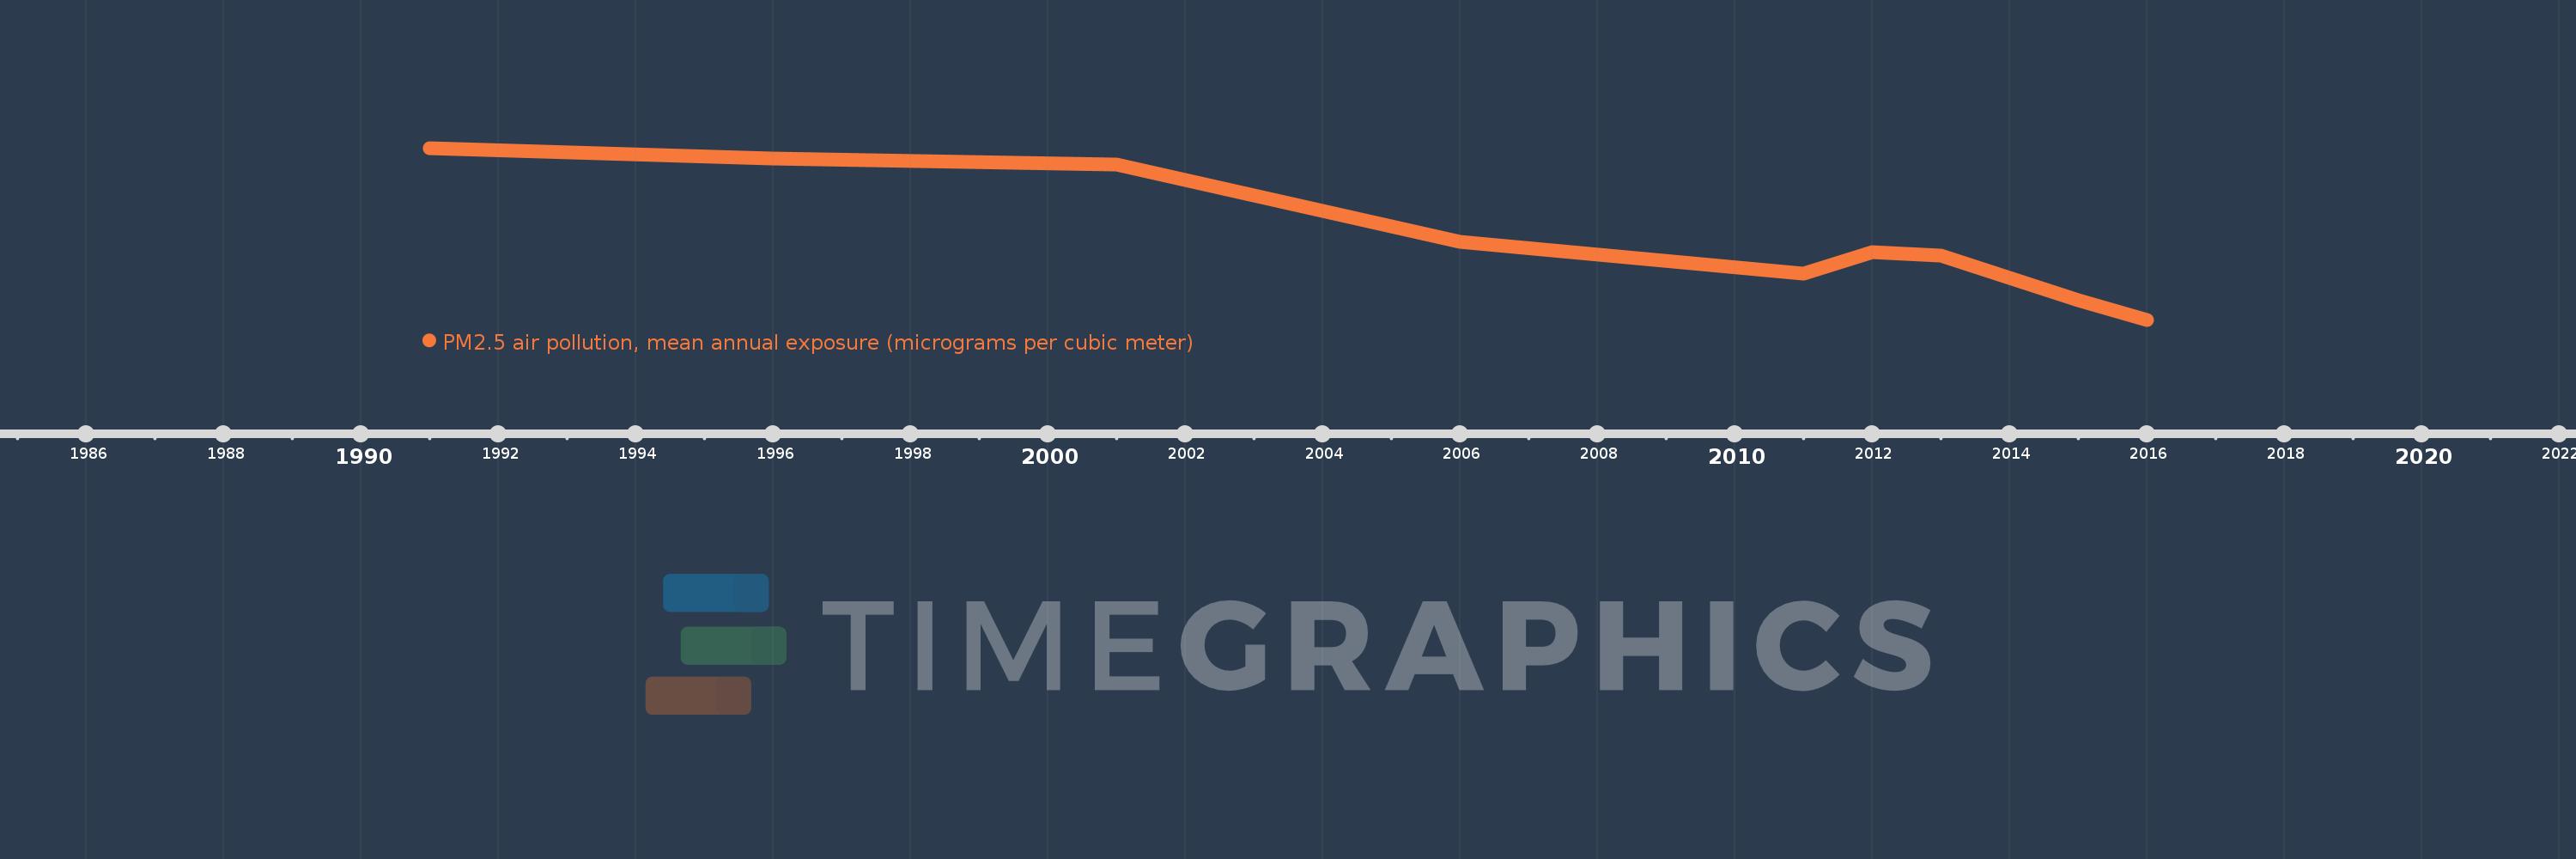
This timeline shows a graph from 1991 to 2016 of Sub-Saharan Africa (IDA & IBRD countries). No data until 1990. Number of actual observations by date: 10.
Source name:
World Development Indicators
Source organization:
Brauer, M. et al. 2016, for the Global Burden of Disease Study 2015.
Categories, topics:
Urban Development, Environment
Last updated:
apr 23, 2017
Indicators value changes by year
Meaning:
38.171
Minimum:
32.324
jan 1, 2016
Maximum:
44.804
jan 1, 1991
At the date of observation
Value
Absolute change
Change from the previous value
jan 1, 1991
44.804
+44.804
0.0%
jan 1, 1996
44.04
-0.765
-1.71%
jan 1, 2001
43.611
-0.429
-0.97%
jan 1, 2006
37.966
-5.645
-12.94%
jan 1, 2011
35.672
-2.293
-6.04%
jan 1, 2012
37.253
+1.581
4.43%
jan 1, 2013
36.959
-0.294
-0.79%
jan 1, 2014
35.365
-1.594
-4.31%
jan 1, 2015
33.713
-1.652
-4.67%
jan 1, 2016
32.324
-1.389
-4.12%
Ranking of countries by current statistics by years
