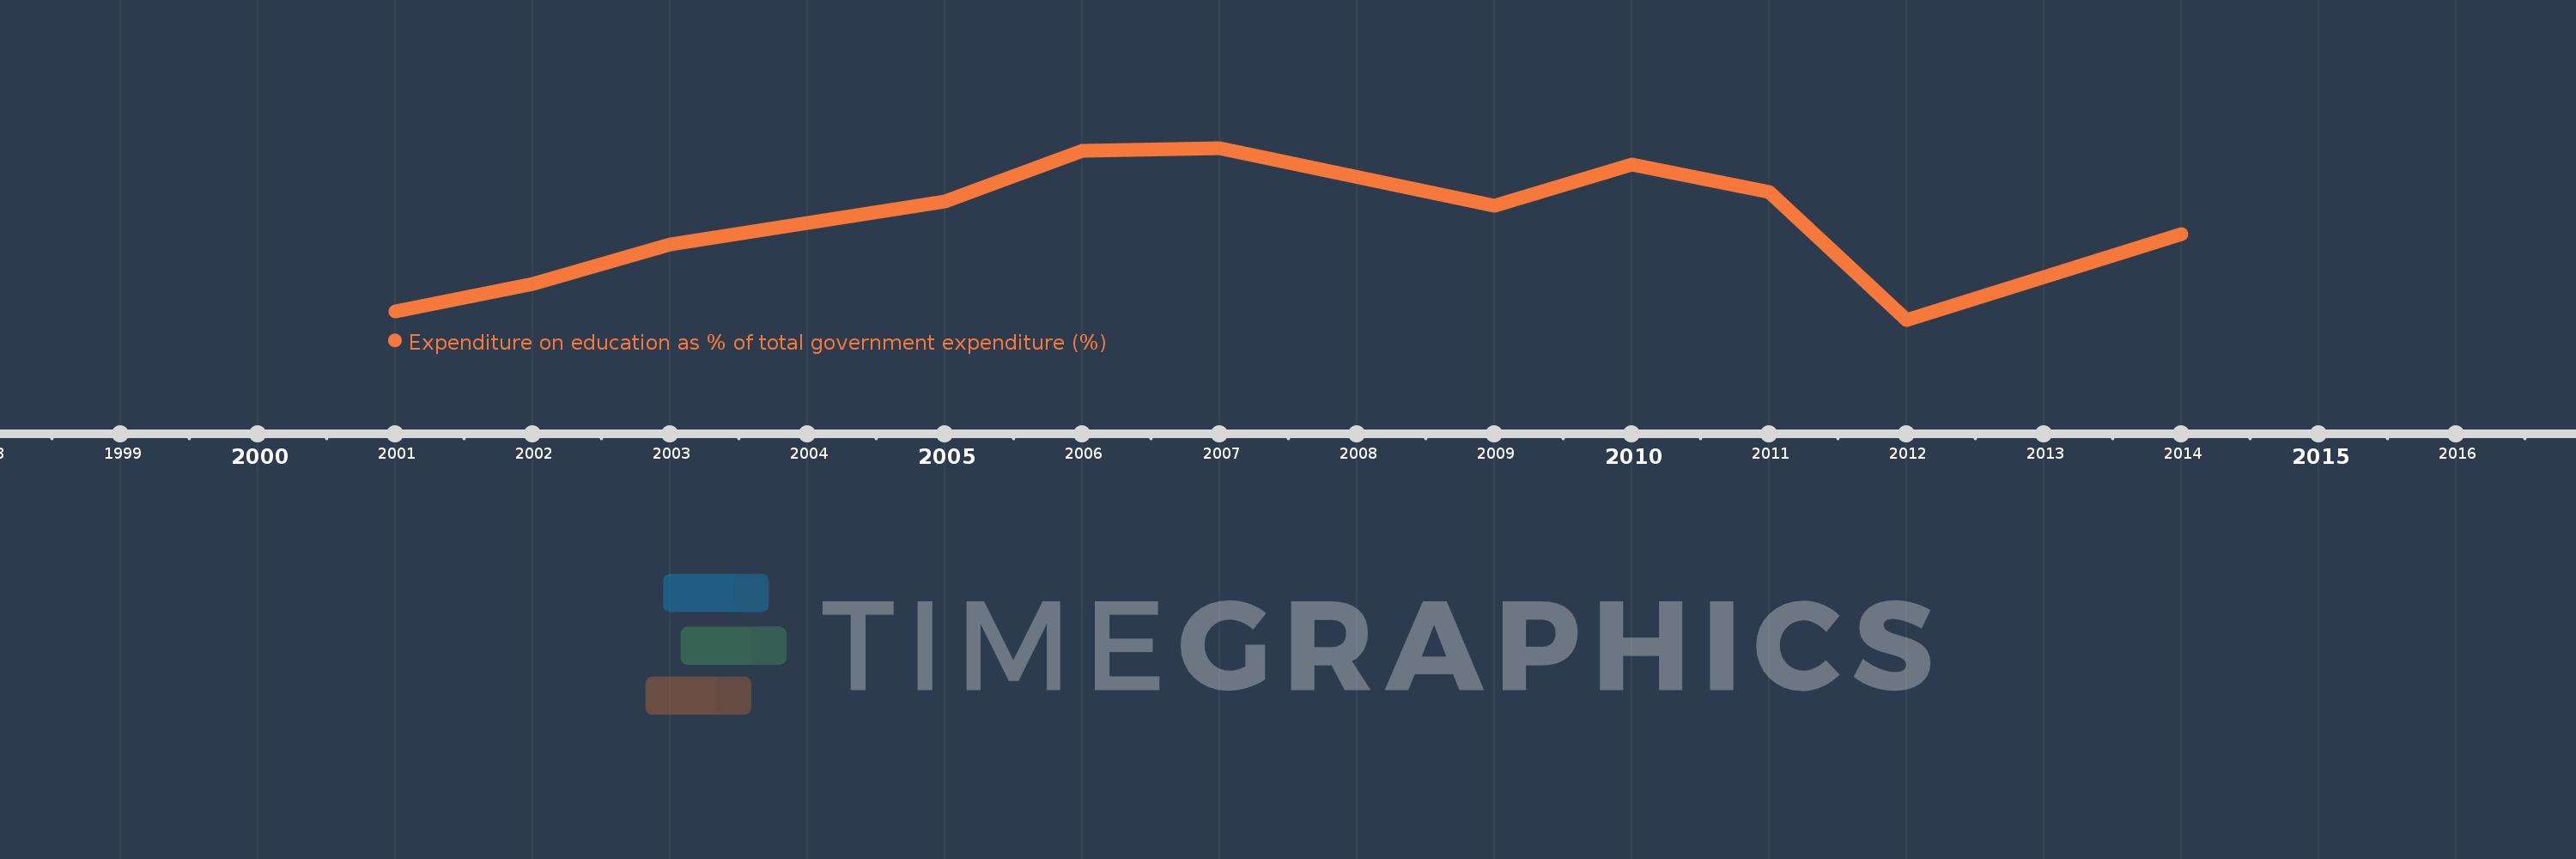
This timeline shows a graph from 2001 to 2014 of Sub-Saharan Africa (IDA & IBRD countries). No data until 2000. Number of actual observations by date: 11.
Source name:
World Development Indicators
Source organization:
UNESCO Institute for Statistics
Categories, topics:
Education
Last updated:
apr 23, 2017
Indicators value changes by year
Meaning:
16.779
Minimum:
15.118
jan 1, 2012
Maximum:
18.078
jan 1, 2007
At the date of observation
Value
Absolute change
Change from the previous value
jan 1, 2001
15.26
+15.26
0.0%
jan 1, 2002
15.73
+0.47
3.08%
jan 1, 2003
16.42
+0.69
4.39%
jan 1, 2005
17.149
+0.729
4.44%
jan 1, 2006
18.033
+0.884
5.16%
jan 1, 2007
18.078
+0.045
0.25%
jan 1, 2009
17.082
-0.996
-5.51%
jan 1, 2010
17.793
+0.711
4.16%
jan 1, 2011
17.313
-0.48
-2.7%
jan 1, 2012
15.118
-2.195
-12.68%
jan 1, 2014
16.597
+1.479
9.78%
Ranking of countries by current statistics by years
