29
/
en
AIzaSyAYiBZKx7MnpbEhh9jyipgxe19OcubqV5w
April 1, 2024
60651
Sub-Saharan Africa (IDA & IBRD countries)
TSS
false
2
1
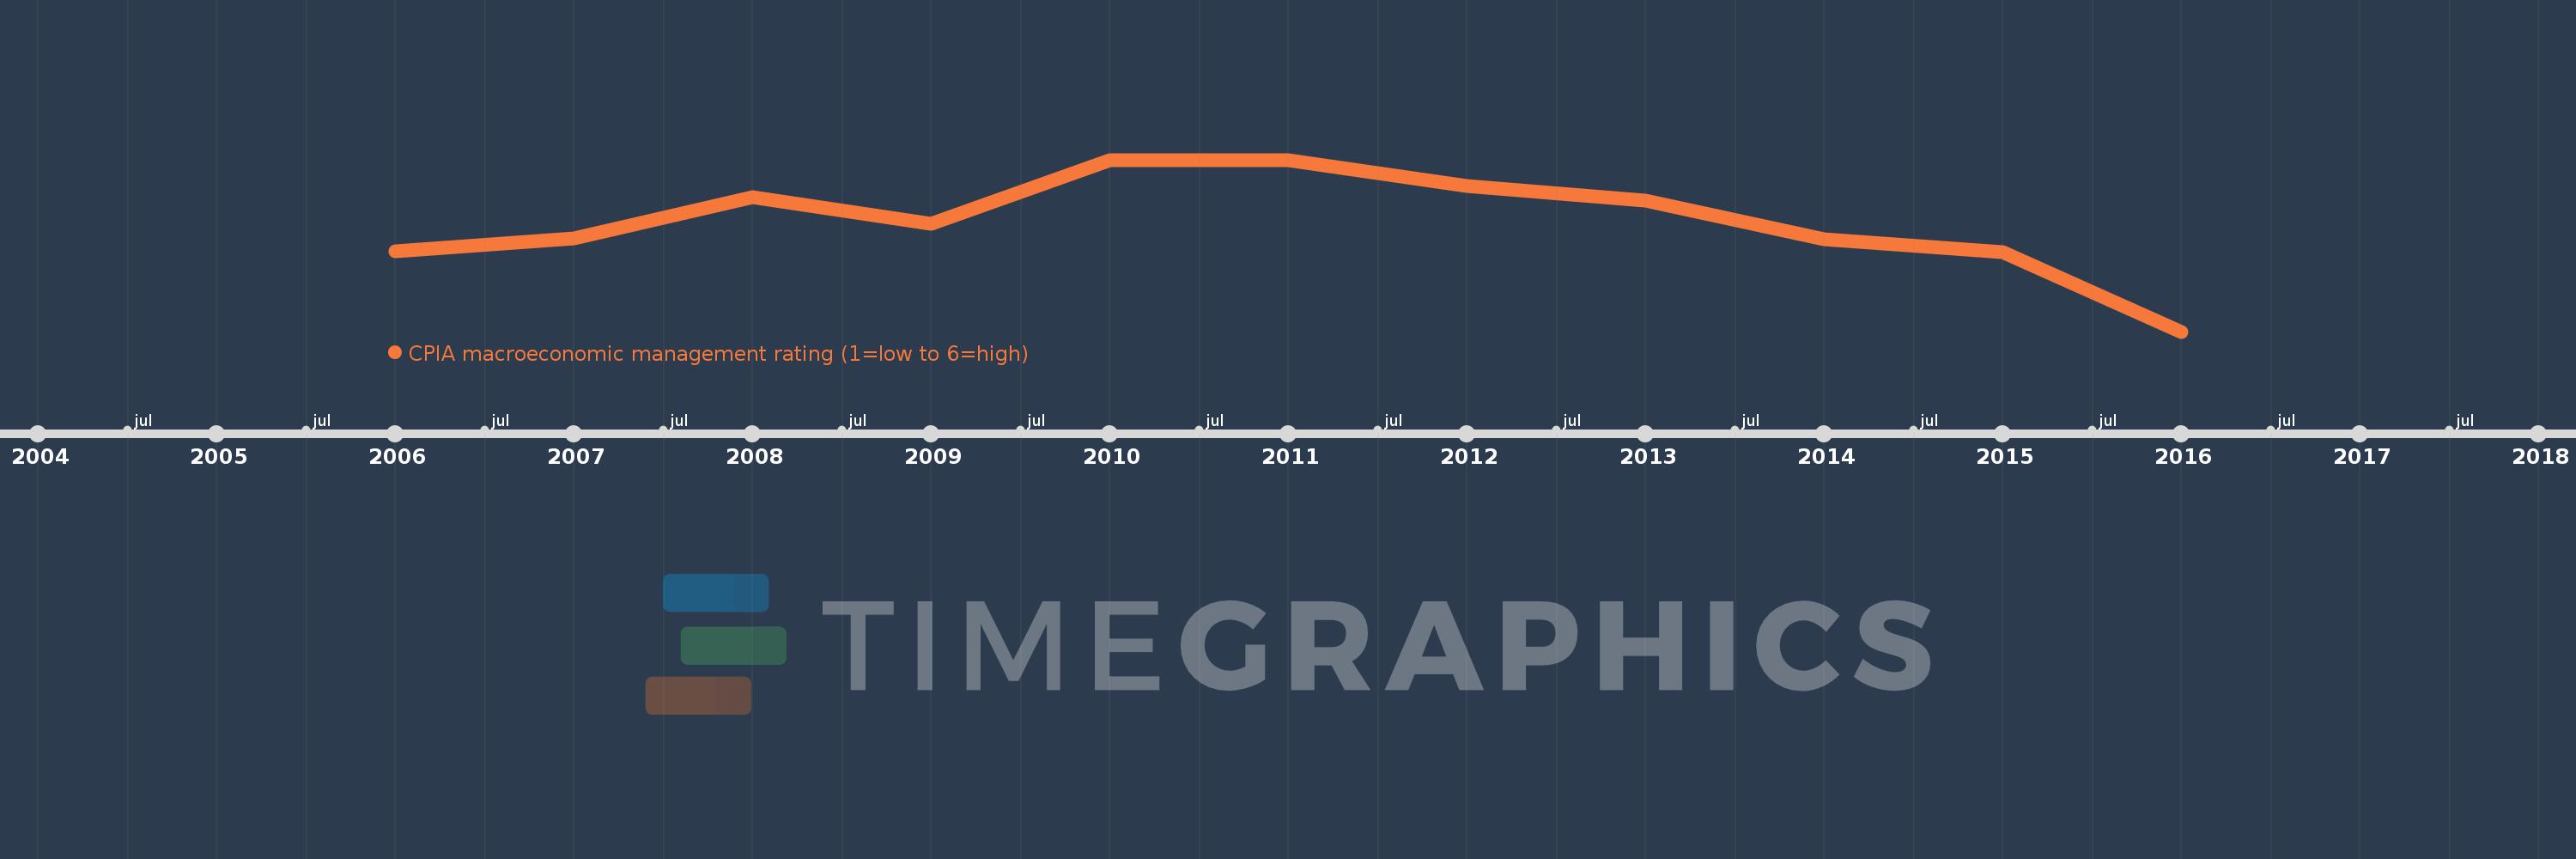
CPIA macroeconomic management rating (1=low to 6=high)
2016,2015,2014,2013,2012,2011,2010,2009,2008,2007,2006
This statistics in other country:
Timeline:
This timeline shows a graph from 2006 to 2016 of Sub-Saharan Africa (IDA & IBRD countries). No data until 2005. Number of actual observations by date: 11.
Source name:
World Development Indicators
Source organization:
World Bank Group, CPIA database (http://www.worldbank.org/ida).
Categories, topics:
Public Sector
Last updated:
apr 23, 2017
Indicators value changes by year
At the date of observation
Value
Absolute change
Change from previous value
jan 1, 2006
3.514
+3.514
0.0%
jan 1, 2007
3.527
+0.014
0.38%
jan 1, 2008
3.568
+0.041
1.15%
jan 1, 2009
3.541
-0.027
-0.76%
jan 1, 2010
3.605
+0.065
1.83%
jan 1, 2011
3.605
0.0
0.0%
jan 1, 2012
3.579
-0.026
-0.73%
jan 1, 2013
3.564
-0.015
-0.41%
jan 1, 2014
3.526
-0.038
-1.08%
jan 1, 2015
3.513
-0.012
-0.35%
jan 1, 2016
3.434
-0.079
-2.25%
Ranking of countries by current statistics by years


Comments: