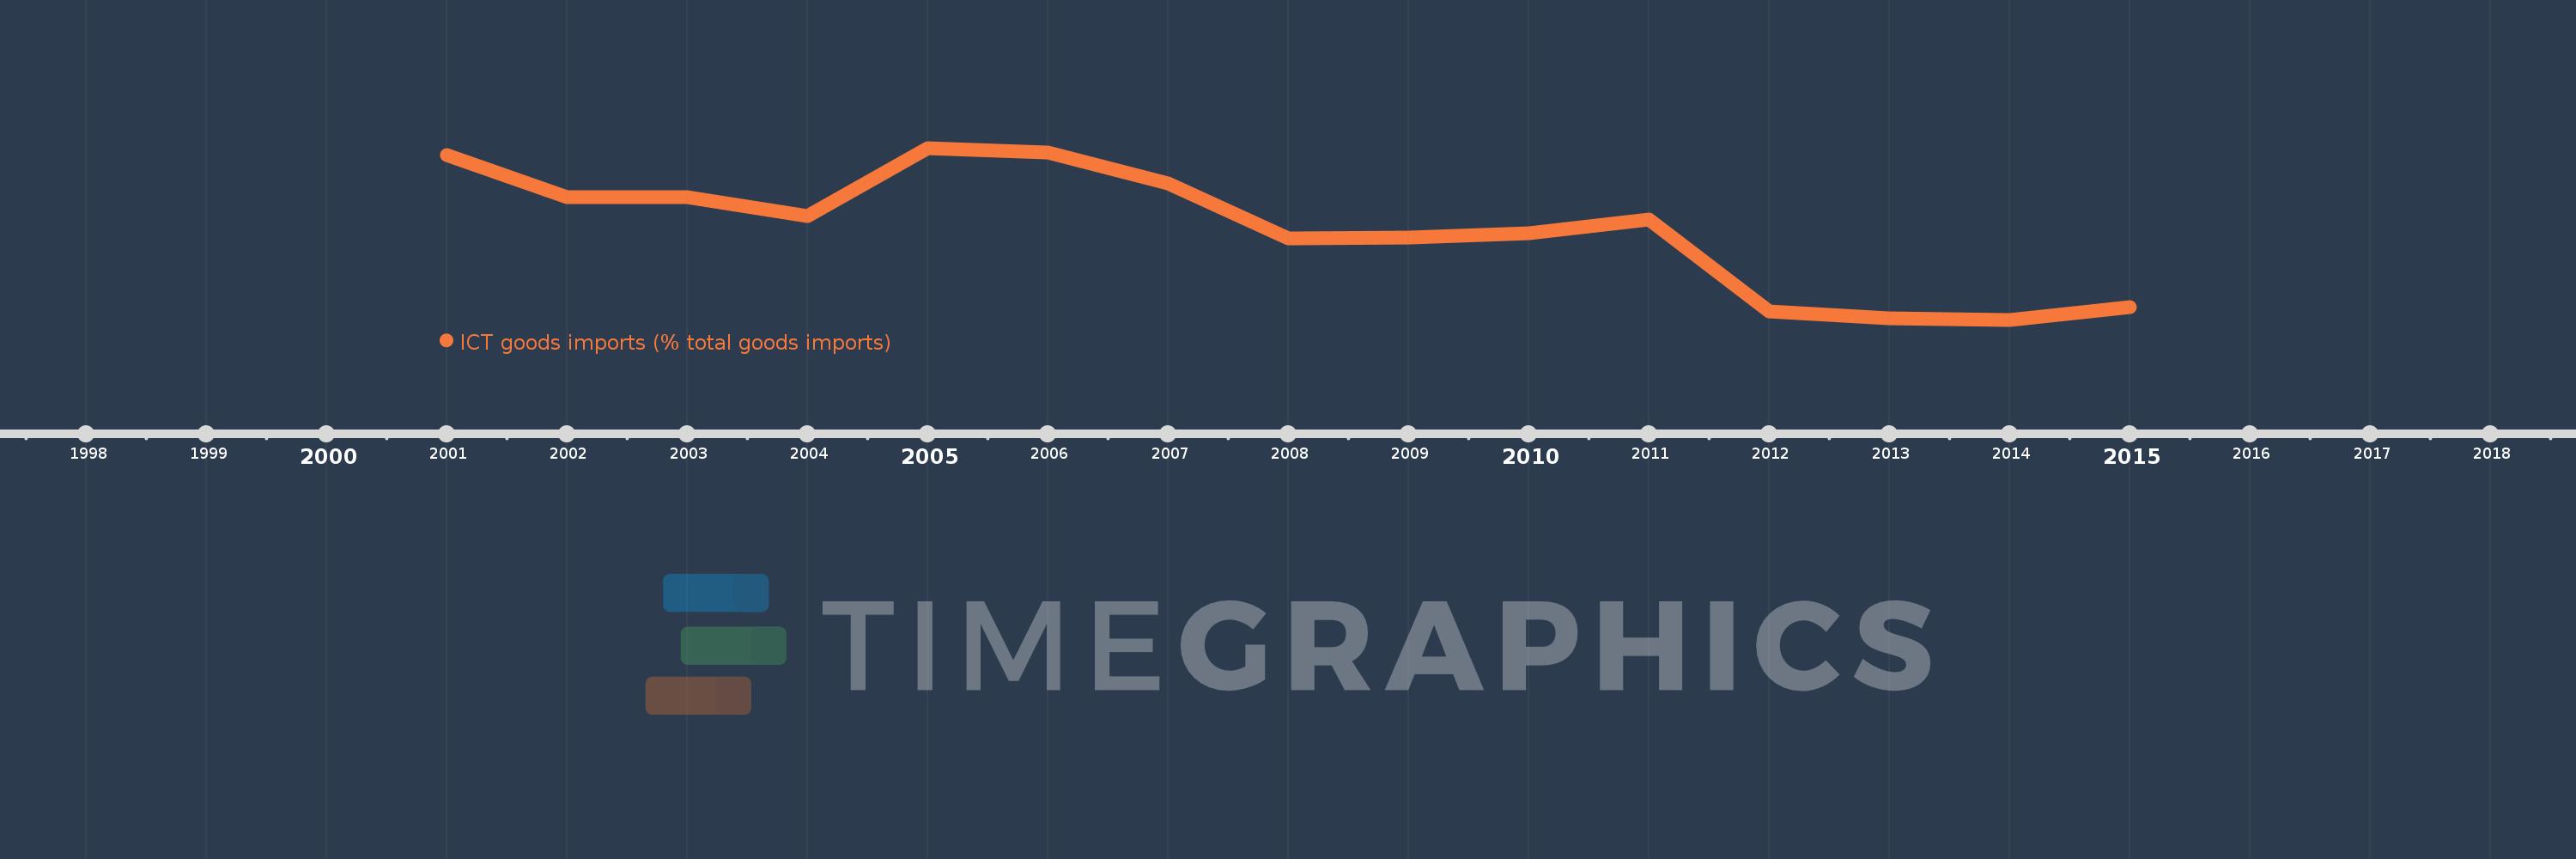
This timeline shows a graph from 2001 to 2015 of Sub-Saharan Africa (excluding high income). No data until 2000. Number of actual observations by date: 15.
Source name:
World Development Indicators
Source organization:
United Nations Conference on Trade and Development's UNCTADstat database at http://unctadstat.unctad.org/ReportFolders/reportFolders.aspx.
Categories, topics:
Infrastructure, Private Sector, Trade
Last updated:
apr 23, 2017
Indicators value changes by year
Meaning:
6.439
Minimum:
5.232
jan 1, 2014
Maximum:
7.518
jan 1, 2005
At the date of observation
Value
Absolute change
Change from the previous value
jan 1, 2001
7.428
+7.428
0.0%
jan 1, 2002
6.863
-0.565
-7.61%
jan 1, 2003
6.86
-0.003
-0.04%
jan 1, 2004
6.613
-0.247
-3.61%
jan 1, 2005
7.518
+0.904
13.68%
jan 1, 2006
7.455
-0.063
-0.84%
jan 1, 2007
7.049
-0.405
-5.44%
jan 1, 2008
6.311
-0.738
-10.47%
jan 1, 2009
6.323
+0.012
0.19%
jan 1, 2010
6.379
+0.056
0.88%
jan 1, 2011
6.568
+0.189
2.96%
jan 1, 2012
5.338
-1.23
-18.73%
jan 1, 2013
5.251
-0.086
-1.62%
jan 1, 2014
5.232
-0.019
-0.36%
jan 1, 2015
5.403
+0.171
3.27%
Ranking of countries by current statistics by years
