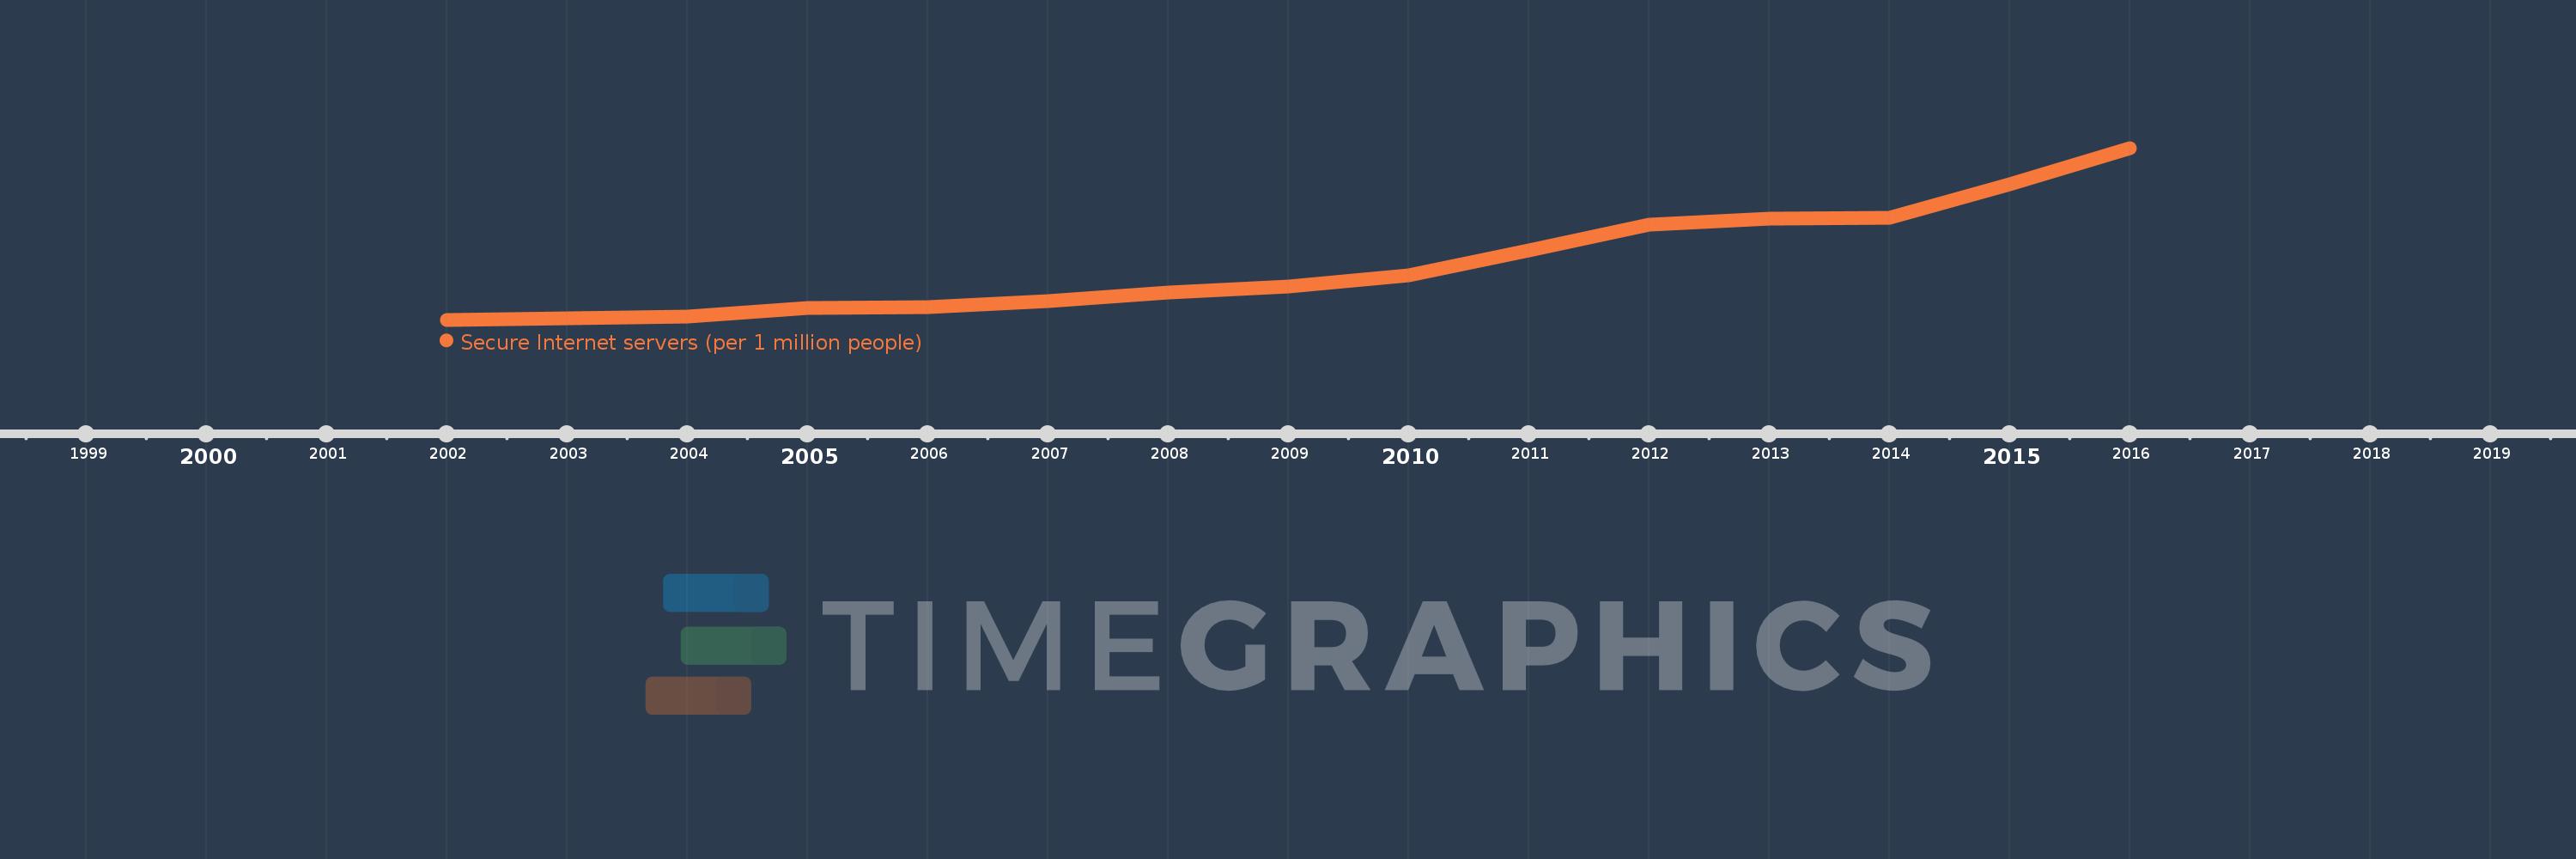
This timeline shows a graph from 2002 to 2016 of Middle East & North Africa (IDA & IBRD countries). No data until 2001. Number of actual observations by date: 14.
Source name:
World Development Indicators
Source organization:
Netcraft (http://www.netcraft.com/) and World Bank population estimates.
Categories, topics:
Infrastructure
Last updated:
apr 23, 2017
Indicators value changes by year
Meaning:
2.059
Minimum:
0.215
jan 1, 2002
Maximum:
5.587
jan 1, 2016
At the date of observation
Value
Absolute change
Change from the previous value
jan 1, 2002
0.215
+0.215
0.0%
jan 1, 2004
0.315
+0.101
46.88%
jan 1, 2005
0.581
+0.265
84.12%
jan 1, 2006
0.609
+0.029
4.92%
jan 1, 2007
0.787
+0.177
29.11%
jan 1, 2008
1.072
+0.285
36.27%
jan 1, 2009
1.244
+0.172
16.06%
jan 1, 2010
1.607
+0.363
29.14%
jan 1, 2011
2.389
+0.782
48.69%
jan 1, 2012
3.195
+0.805
33.71%
jan 1, 2013
3.372
+0.177
5.54%
jan 1, 2014
3.394
+0.023
0.67%
jan 1, 2015
4.458
+1.064
31.34%
jan 1, 2016
5.587
+1.129
25.34%
Ranking of countries by current statistics by years
