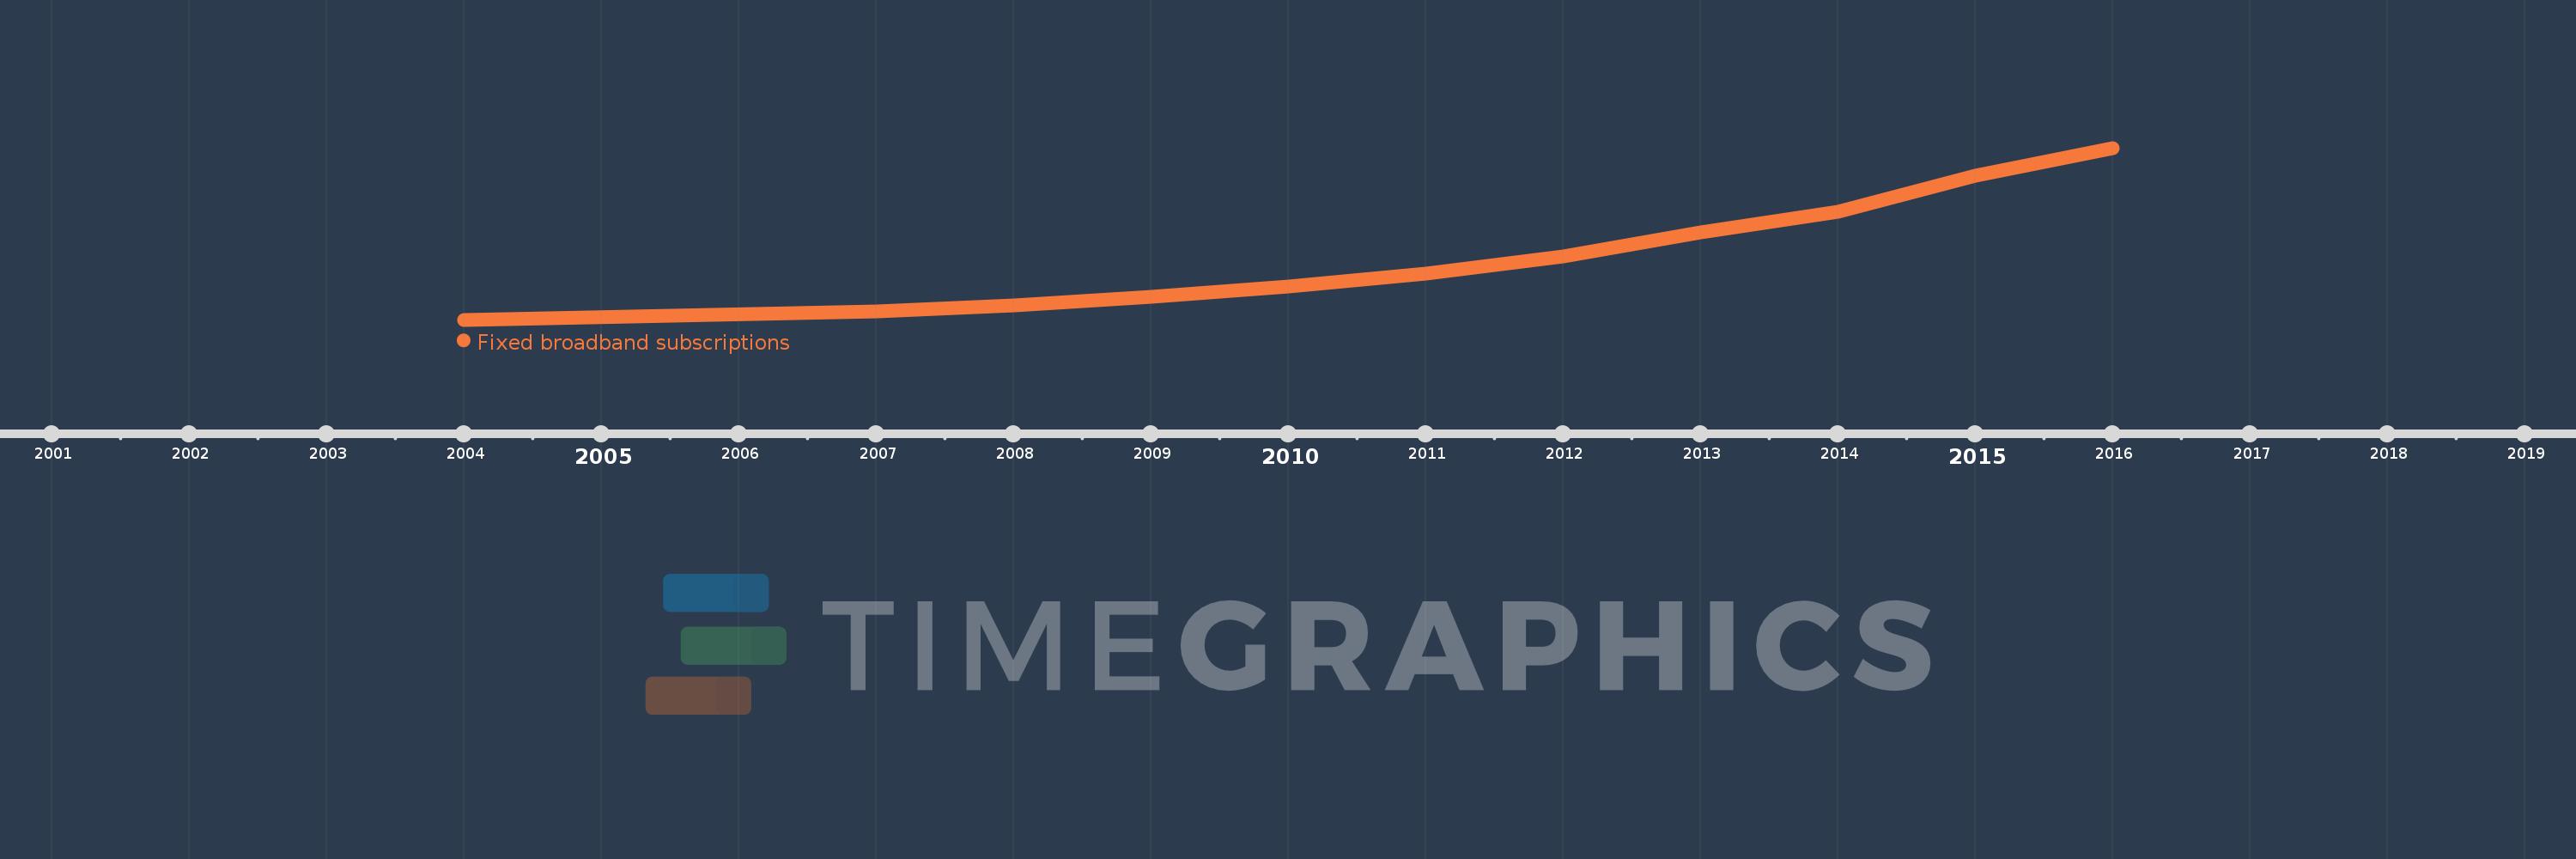
This timeline shows a graph from 2004 to 2016 of Middle East & North Africa (IDA & IBRD countries). No data until 2003. Number of actual observations by date: 11.
Source name:
World Development Indicators
Source organization:
International Telecommunication Union, World Telecommunication/ICT Development Report and database.
Categories, topics:
Infrastructure
Last updated:
apr 23, 2017
Indicators value changes by year
Meaning:
7.106 mln
Minimum:
99.517K
jan 1, 2004
Maximum:
19.005 mln
jan 1, 2016
At the date of observation
Value
Absolute change
Change from the previous value
jan 1, 2004
99.517K
+99.517K
0.0%
jan 1, 2007
1.021 mln
+921.51K
925.98%
jan 1, 2008
1.696 mln
+674.685K
66.08%
jan 1, 2009
2.607 mln
+911.228K
53.74%
jan 1, 2010
3.74 mln
+1.133 mln
43.46%
jan 1, 2011
5.188 mln
+1.448 mln
38.72%
jan 1, 2012
7.111 mln
+1.923 mln
37.06%
jan 1, 2013
9.732 mln
+2.621 mln
36.86%
jan 1, 2014
11.975 mln
+2.243 mln
23.05%
jan 1, 2015
15.994 mln
+4.019 mln
33.56%
jan 1, 2016
19.005 mln
+3.011 mln
18.83%
Ranking of countries by current statistics by years
