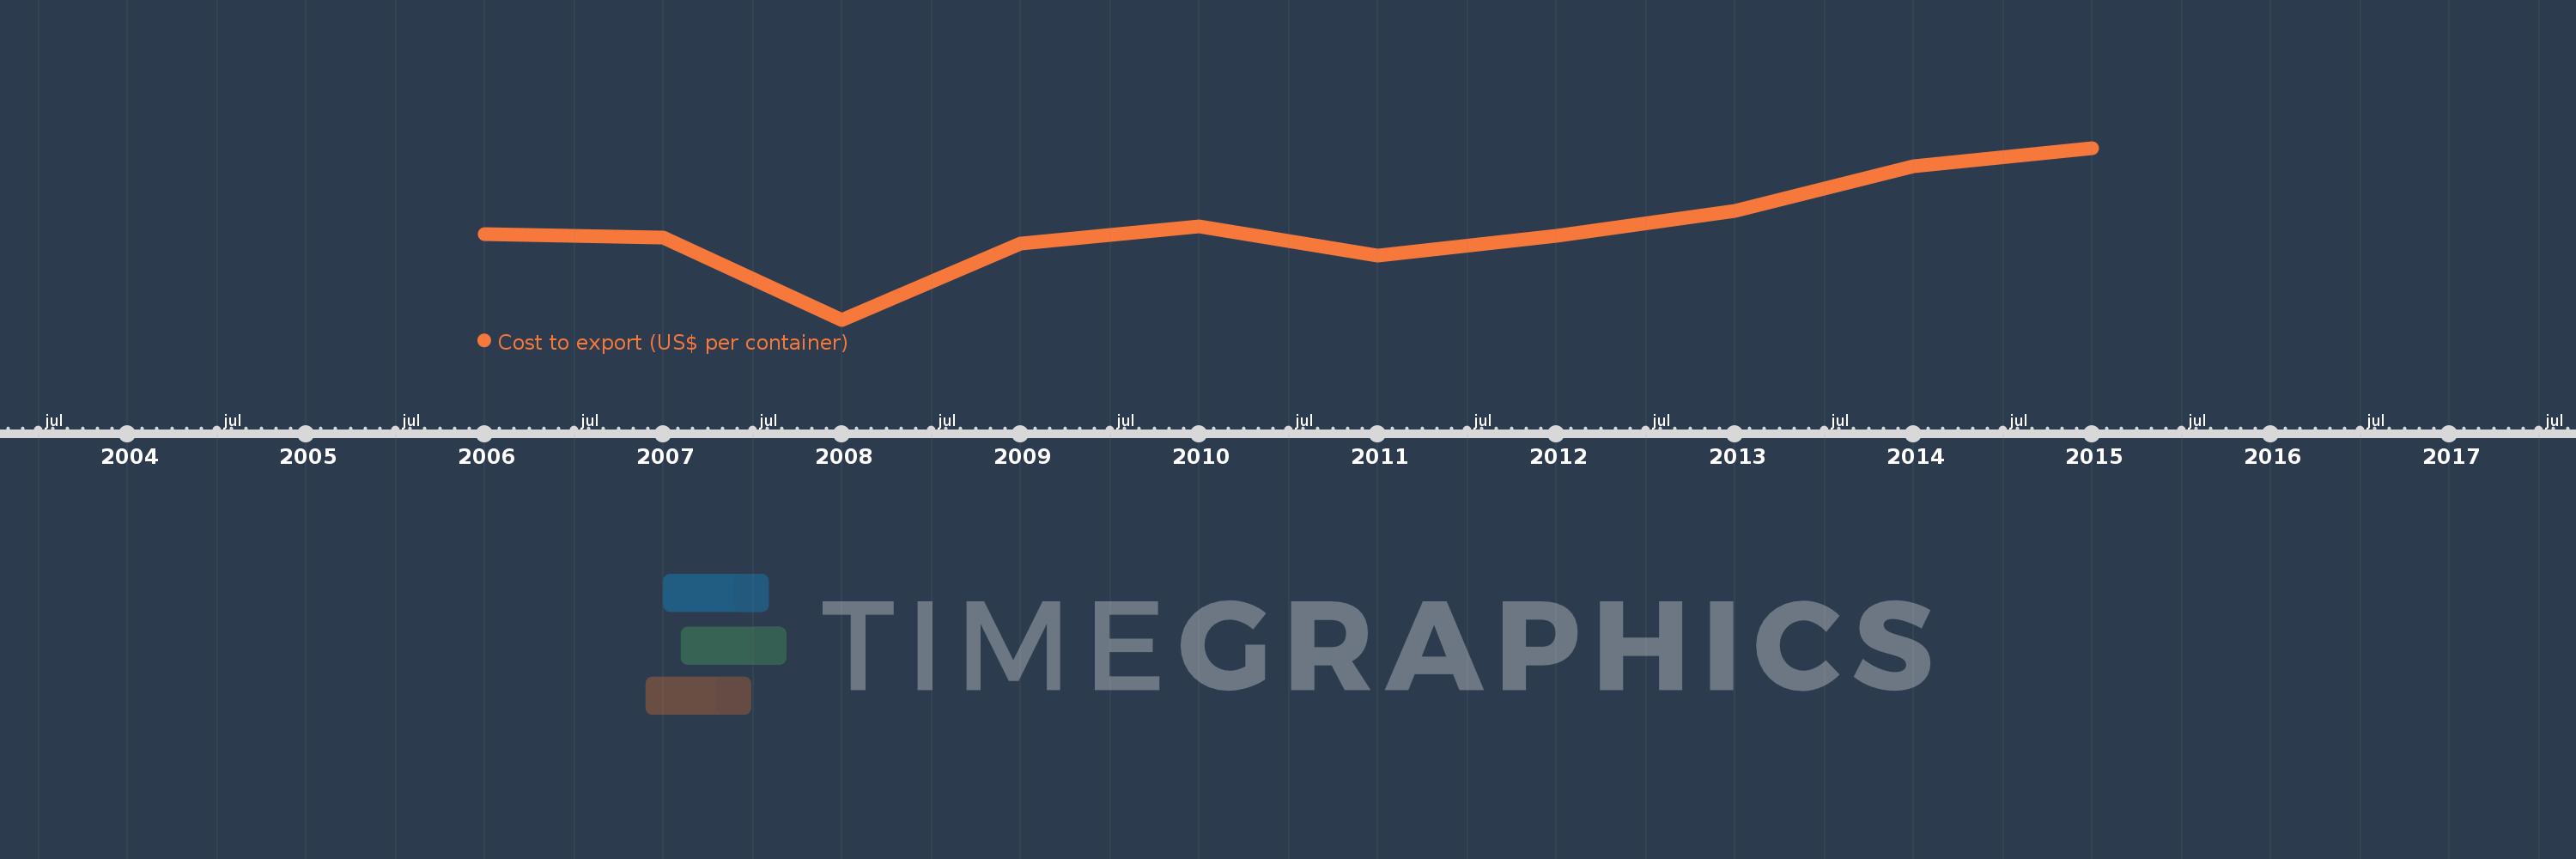
This timeline shows a graph from 2006 to 2015 of Middle East & North Africa (IDA & IBRD countries). No data until 2005. Number of actual observations by date: 10.
Source name:
World Development Indicators
Source organization:
World Bank, Doing Business project (http://www.doingbusiness.org/).
Categories, topics:
Private Sector, Trade
Last updated:
apr 23, 2017
Indicators value changes by year
Meaning:
1.179K
Minimum:
1.08K
jan 1, 2008
Maximum:
1.265K
jan 1, 2015
At the date of observation
Value
Absolute change
Change from the previous value
jan 1, 2006
1.173K
+1.173K
0.0%
jan 1, 2007
1.169K
-3.636
-0.31%
jan 1, 2008
1.08K
-89.091
-7.62%
jan 1, 2009
1.162K
+81.818
7.57%
jan 1, 2010
1.181K
+19.273
1.66%
jan 1, 2011
1.149K
-32.0
-2.71%
jan 1, 2012
1.171K
+21.364
1.86%
jan 1, 2013
1.198K
+26.947
2.3%
jan 1, 2014
1.246K
+48.25
4.03%
jan 1, 2015
1.265K
+19.583
1.57%
Ranking of countries by current statistics by years
