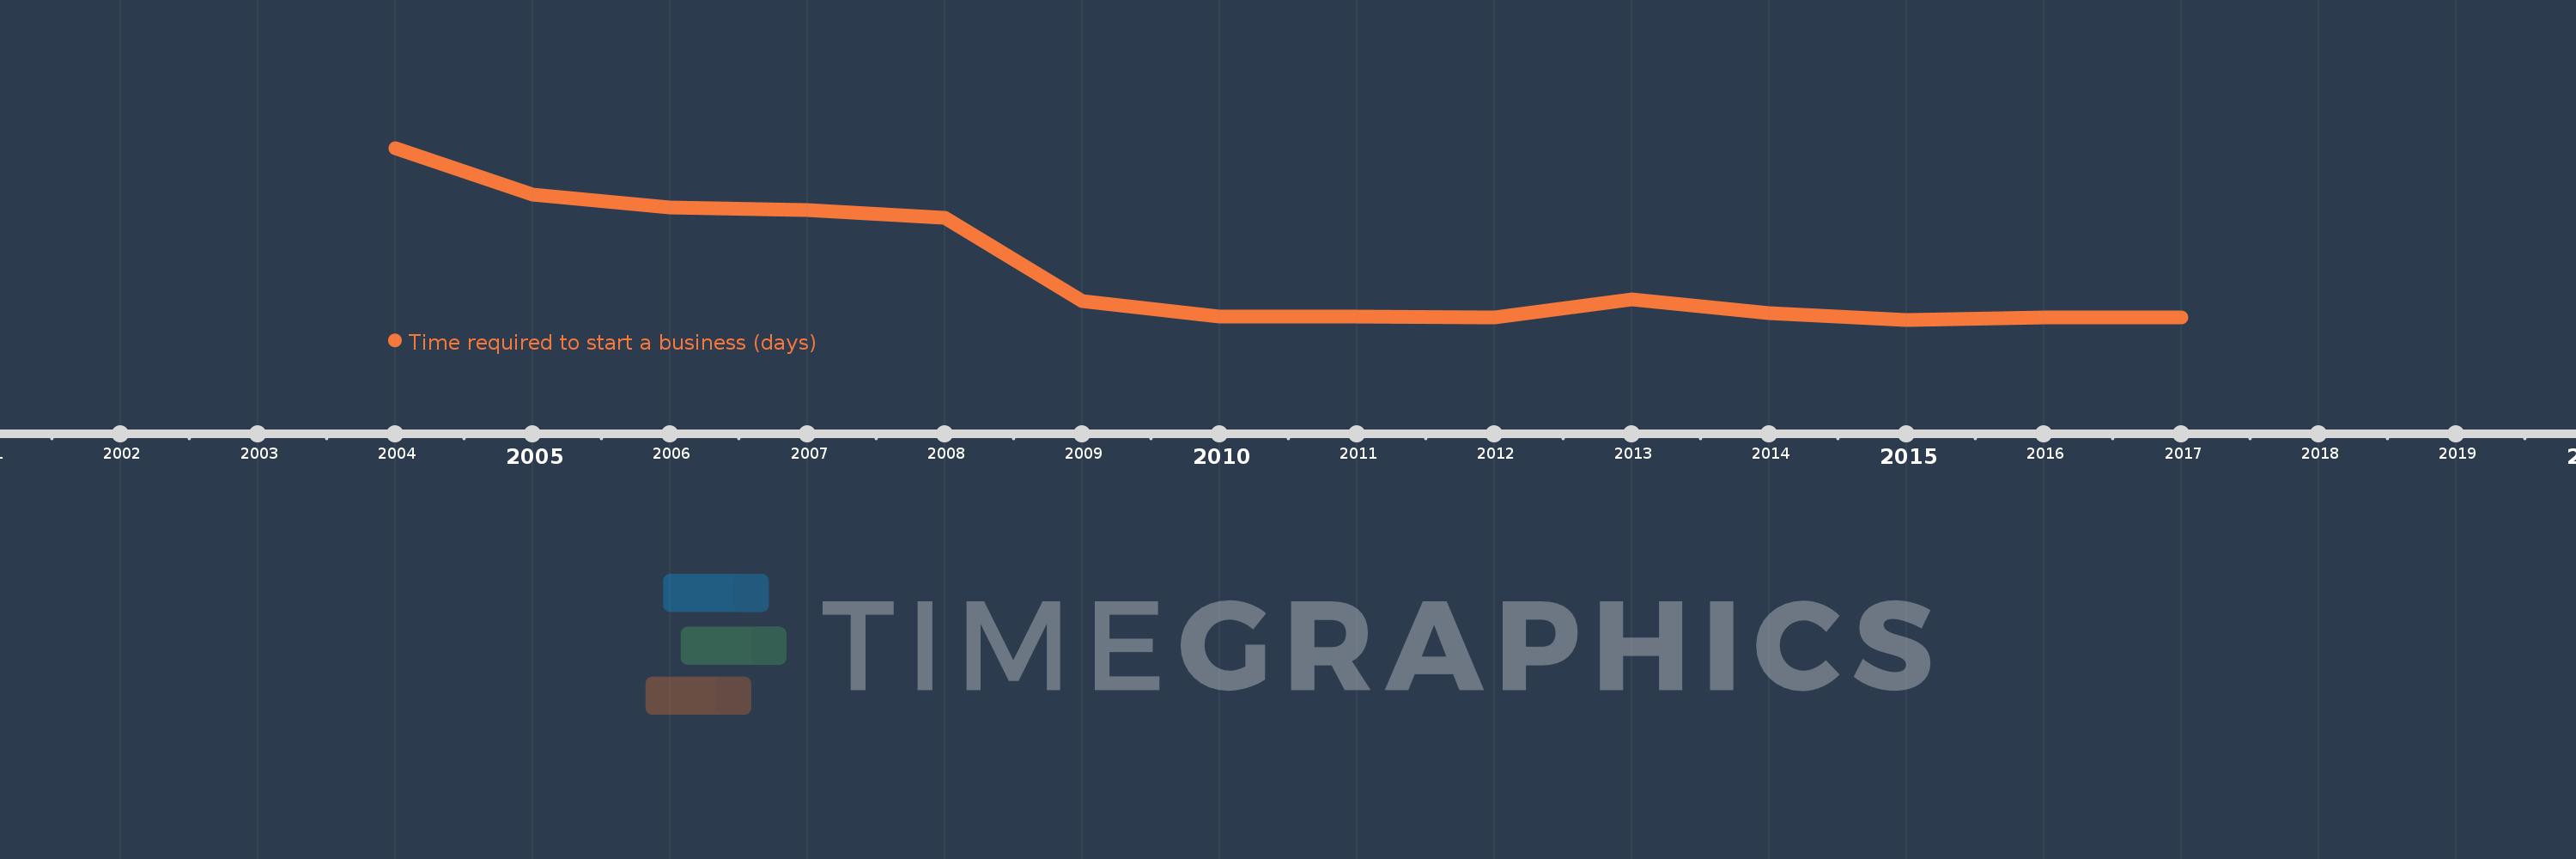
This timeline shows a graph from 2004 to 2017 of Middle East & North Africa (excluding high income). No data until 2003. Number of actual observations by date: 14.
Source name:
World Development Indicators
Source organization:
World Bank, Doing Business project (http://www.doingbusiness.org/).
Categories, topics:
Private Sector
Last updated:
apr 23, 2017
Indicators value changes by year
Meaning:
27.105
Minimum:
20.731
jan 1, 2015
Maximum:
43.278
jan 1, 2004
At the date of observation
Value
Absolute change
Change from the previous value
jan 1, 2004
43.278
+43.278
0.0%
jan 1, 2005
37.136
-6.141
-14.19%
jan 1, 2006
35.458
-1.678
-4.52%
jan 1, 2007
35.125
-0.333
-0.94%
jan 1, 2008
34.125
-1.0
-2.85%
jan 1, 2009
23.208
-10.917
-31.99%
jan 1, 2010
21.125
-2.083
-8.98%
jan 1, 2011
21.125
0.0
0.0%
jan 1, 2012
21.042
-0.083
-0.39%
jan 1, 2013
23.423
+2.381
11.32%
jan 1, 2014
21.654
-1.769
-7.55%
jan 1, 2015
20.731
-0.923
-4.26%
jan 1, 2016
21.038
+0.308
1.48%
jan 1, 2017
21.0
-0.038
-0.18%
Ranking of countries by current statistics by years
