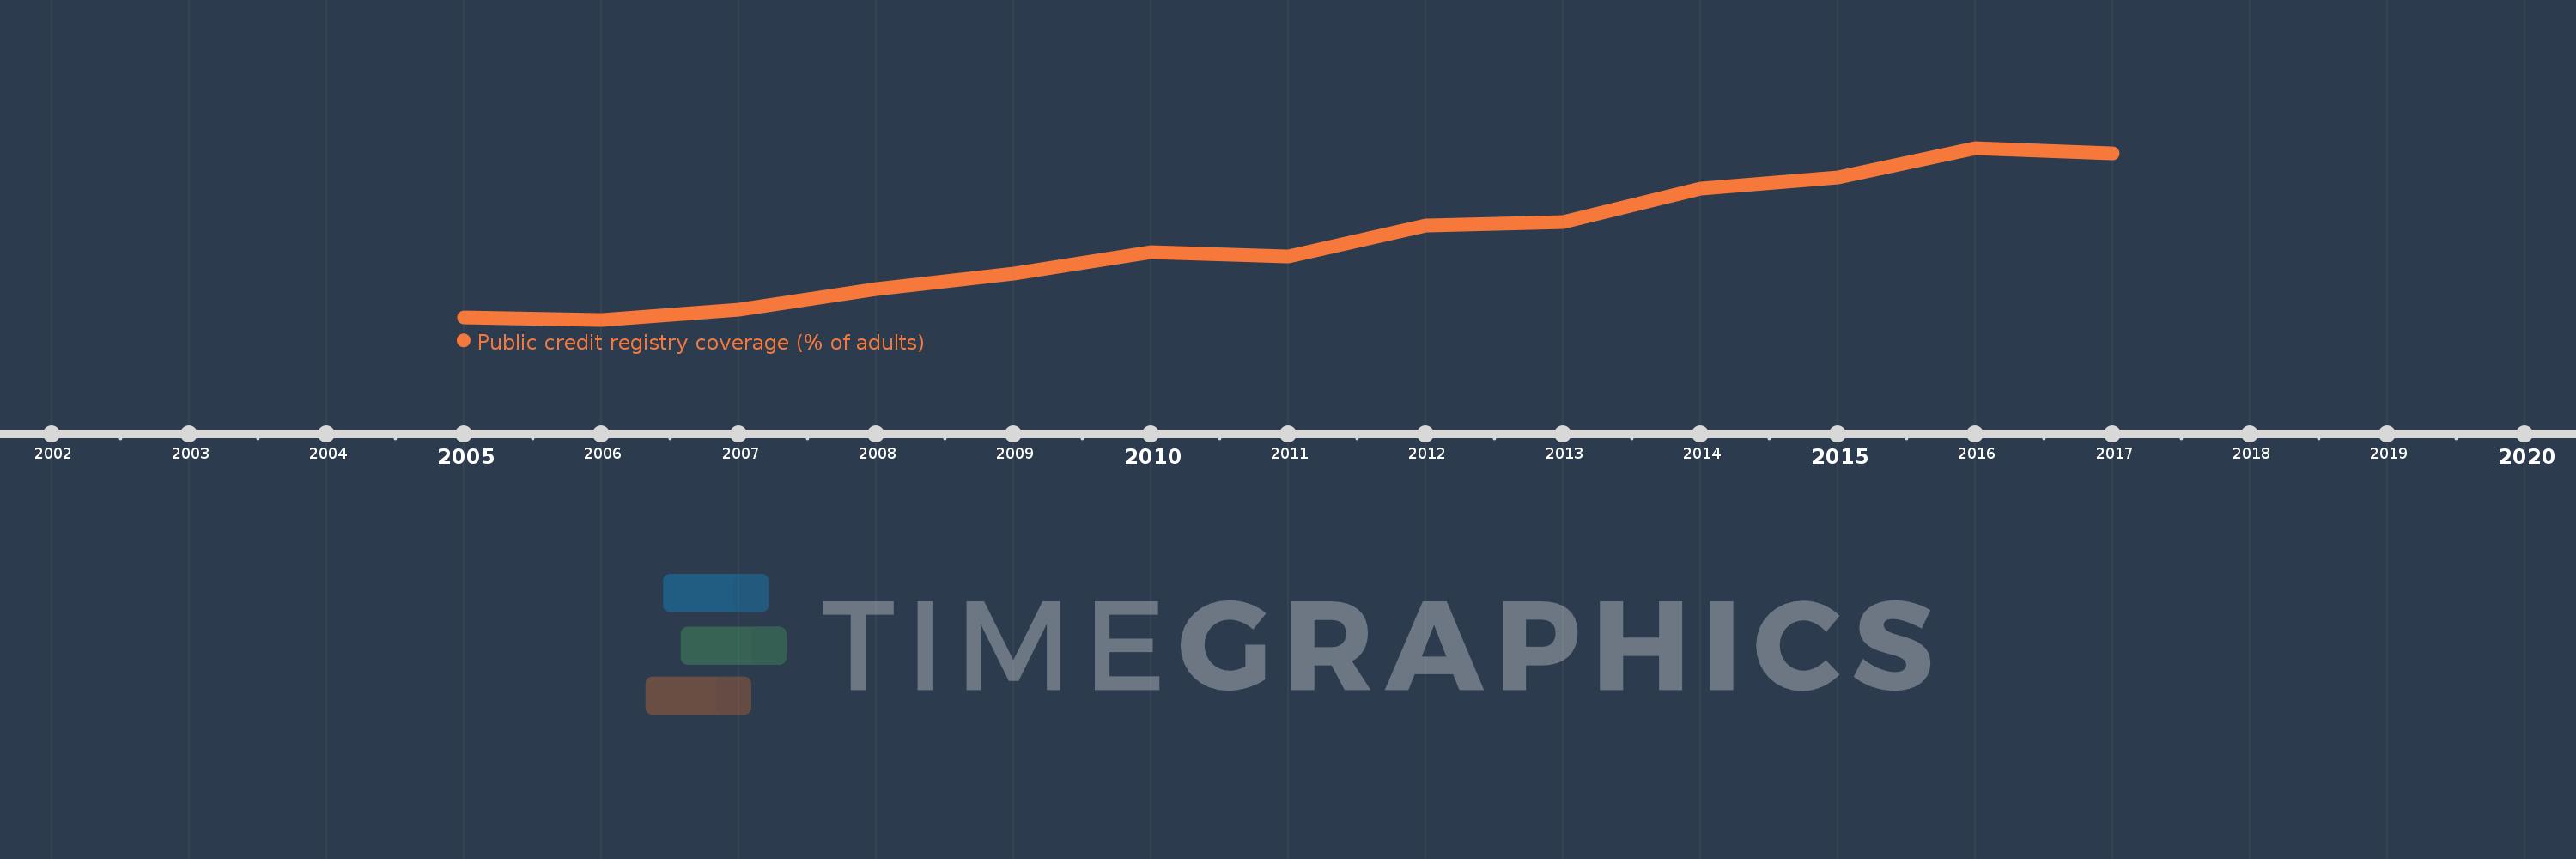
This timeline shows a graph from 2005 to 2017 of Middle East & North Africa (excluding high income). No data until 2004. Number of actual observations by date: 13.
Source name:
World Development Indicators
Source organization:
World Bank, Doing Business project (http://www.doingbusiness.org/).
Categories, topics:
Financial Sector, Private Sector, Public Sector
Last updated:
apr 23, 2017
Indicators value changes by year
Meaning:
6.383
Minimum:
2.458
jan 1, 2006
Maximum:
11.031
jan 1, 2016
At the date of observation
Value
Absolute change
Change from the previous value
jan 1, 2005
2.564
+2.564
0.0%
jan 1, 2006
2.458
-0.105
-4.11%
jan 1, 2007
2.942
+0.483
19.66%
jan 1, 2008
3.975
+1.033
35.13%
jan 1, 2009
4.775
+0.8
20.13%
jan 1, 2010
5.842
+1.067
22.34%
jan 1, 2011
5.6
-0.242
-4.14%
jan 1, 2012
7.158
+1.558
27.83%
jan 1, 2013
7.338
+0.18
2.52%
jan 1, 2014
8.992
+1.654
22.54%
jan 1, 2015
9.554
+0.562
6.24%
jan 1, 2016
11.031
+1.477
15.46%
jan 1, 2017
10.746
-0.285
-2.58%
Ranking of countries by current statistics by years
