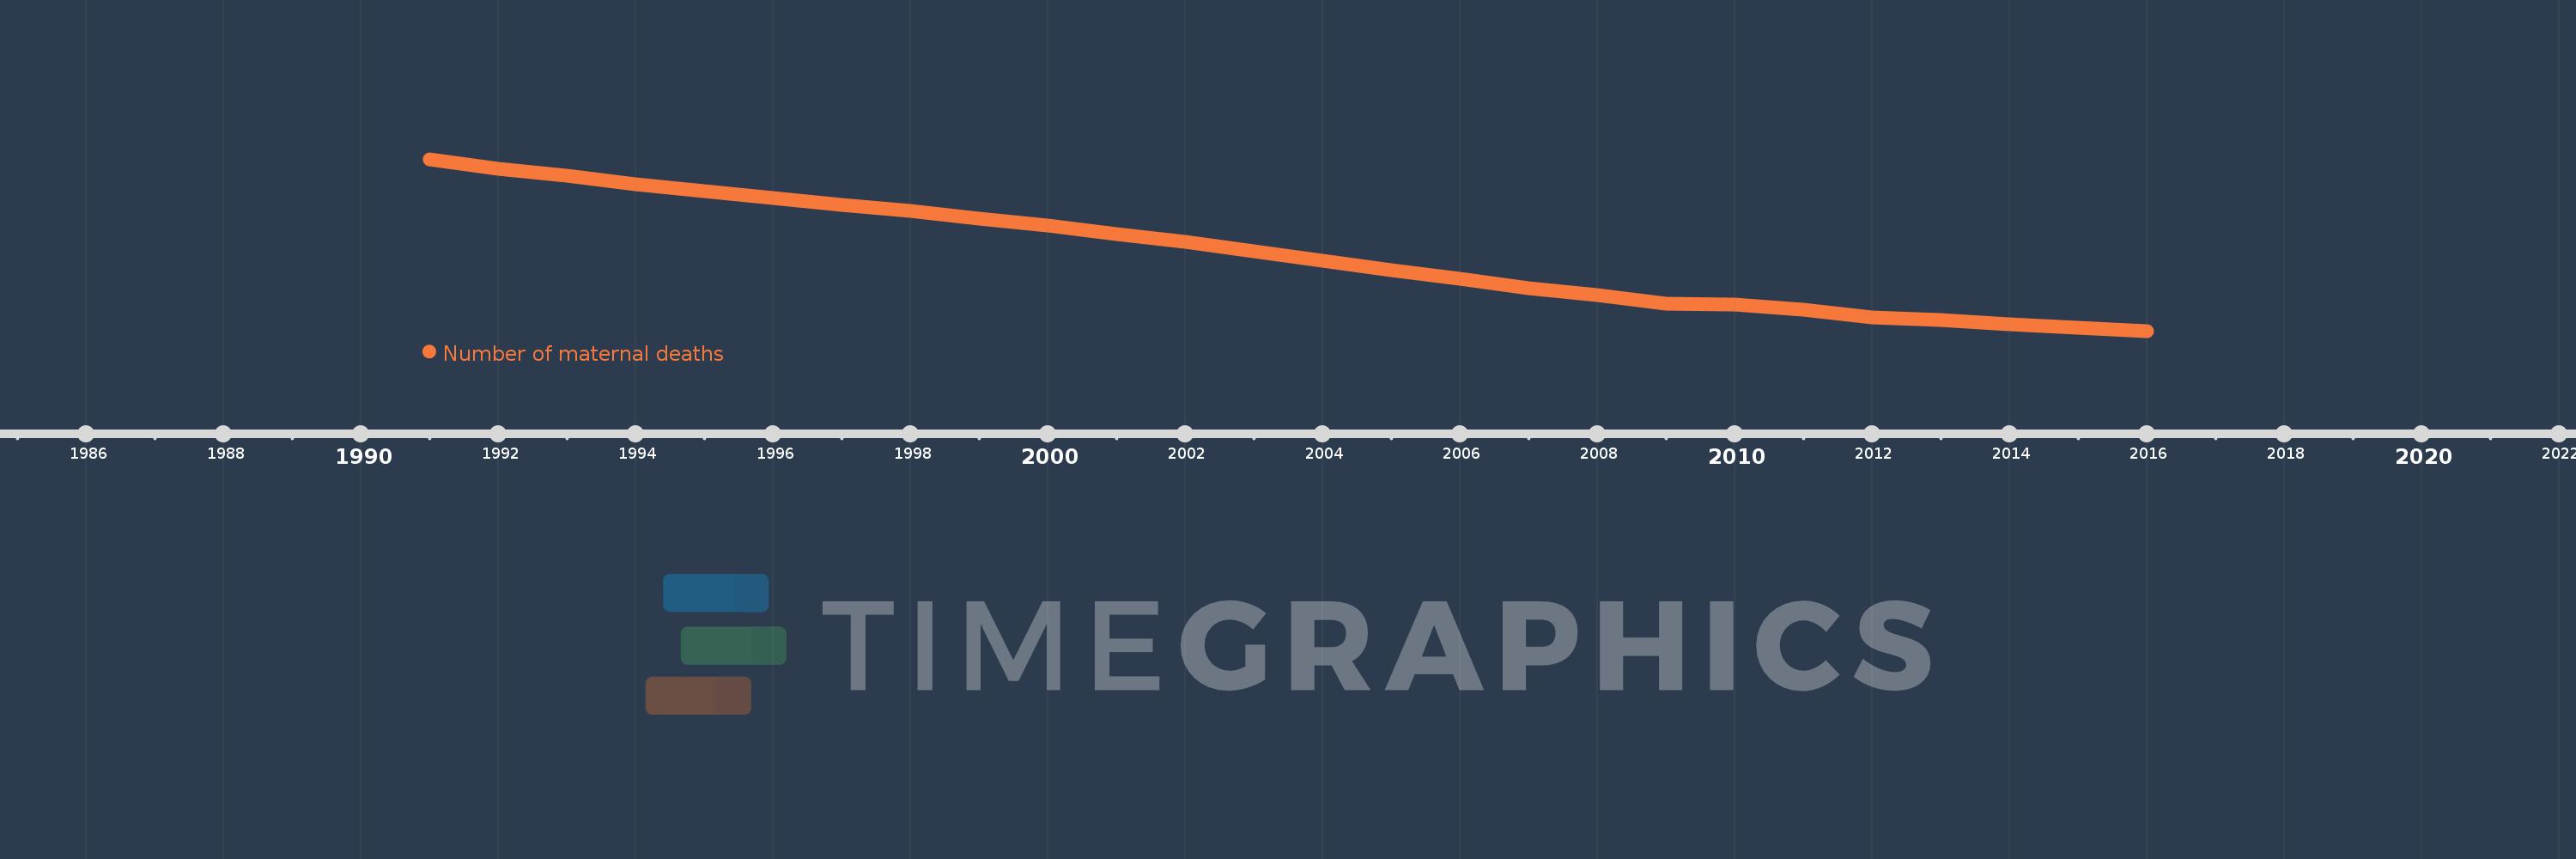
This timeline shows a graph from 1991 to 2016 of Lower middle income. No data until 1990. Number of actual observations by date: 26.
Source name:
World Development Indicators
Source organization:
WHO, UNICEF, UNFPA, World Bank Group, and the United Nations Population Division. Trends in Maternal Mortality: 1990 to 2015. Geneva, World Health Organization, 2015
Categories, topics:
Health
Last updated:
apr 23, 2017
Indicators value changes by year
Meaning:
240.769K
Minimum:
168.0K
jan 1, 2016
Maximum:
330.0K
jan 1, 1991
At the date of observation
Value
Absolute change
Change from the previous value
jan 1, 1991
330.0K
+330.0K
0.0%
jan 1, 1992
321.0K
-9.0K
-2.73%
jan 1, 1993
314.0K
-7.0K
-2.18%
jan 1, 1994
306.0K
-8.0K
-2.55%
jan 1, 1995
300.0K
-6.0K
-1.96%
jan 1, 1996
293.0K
-7.0K
-2.33%
jan 1, 1997
287.0K
-6.0K
-2.05%
jan 1, 1998
281.0K
-6.0K
-2.09%
jan 1, 1999
274.0K
-7.0K
-2.49%
jan 1, 2000
267.0K
-7.0K
-2.55%
jan 1, 2001
259.0K
-8.0K
-3.0%
jan 1, 2002
252.0K
-7.0K
-2.7%
jan 1, 2003
243.0K
-9.0K
-3.57%
jan 1, 2004
234.0K
-9.0K
-3.7%
jan 1, 2005
225.0K
-9.0K
-3.85%
jan 1, 2006
217.0K
-8.0K
-3.56%
jan 1, 2007
208.0K
-9.0K
-4.15%
jan 1, 2008
202.0K
-6.0K
-2.88%
jan 1, 2009
194.0K
-8.0K
-3.96%
jan 1, 2010
193.0K
-1000.0
-0.52%
jan 1, 2011
188.0K
-5.0K
-2.59%
jan 1, 2012
181.0K
-7.0K
-3.72%
jan 1, 2013
178.0K
-3.0K
-1.66%
jan 1, 2014
174.0K
-4.0K
-2.25%
jan 1, 2015
171.0K
-3.0K
-1.72%
jan 1, 2016
168.0K
-3.0K
-1.75%
Ranking of countries by current statistics by years
