29
/
en
AIzaSyAYiBZKx7MnpbEhh9jyipgxe19OcubqV5w
April 1, 2024
44343
Least developed countries: UN classification
LDC
false
2
1
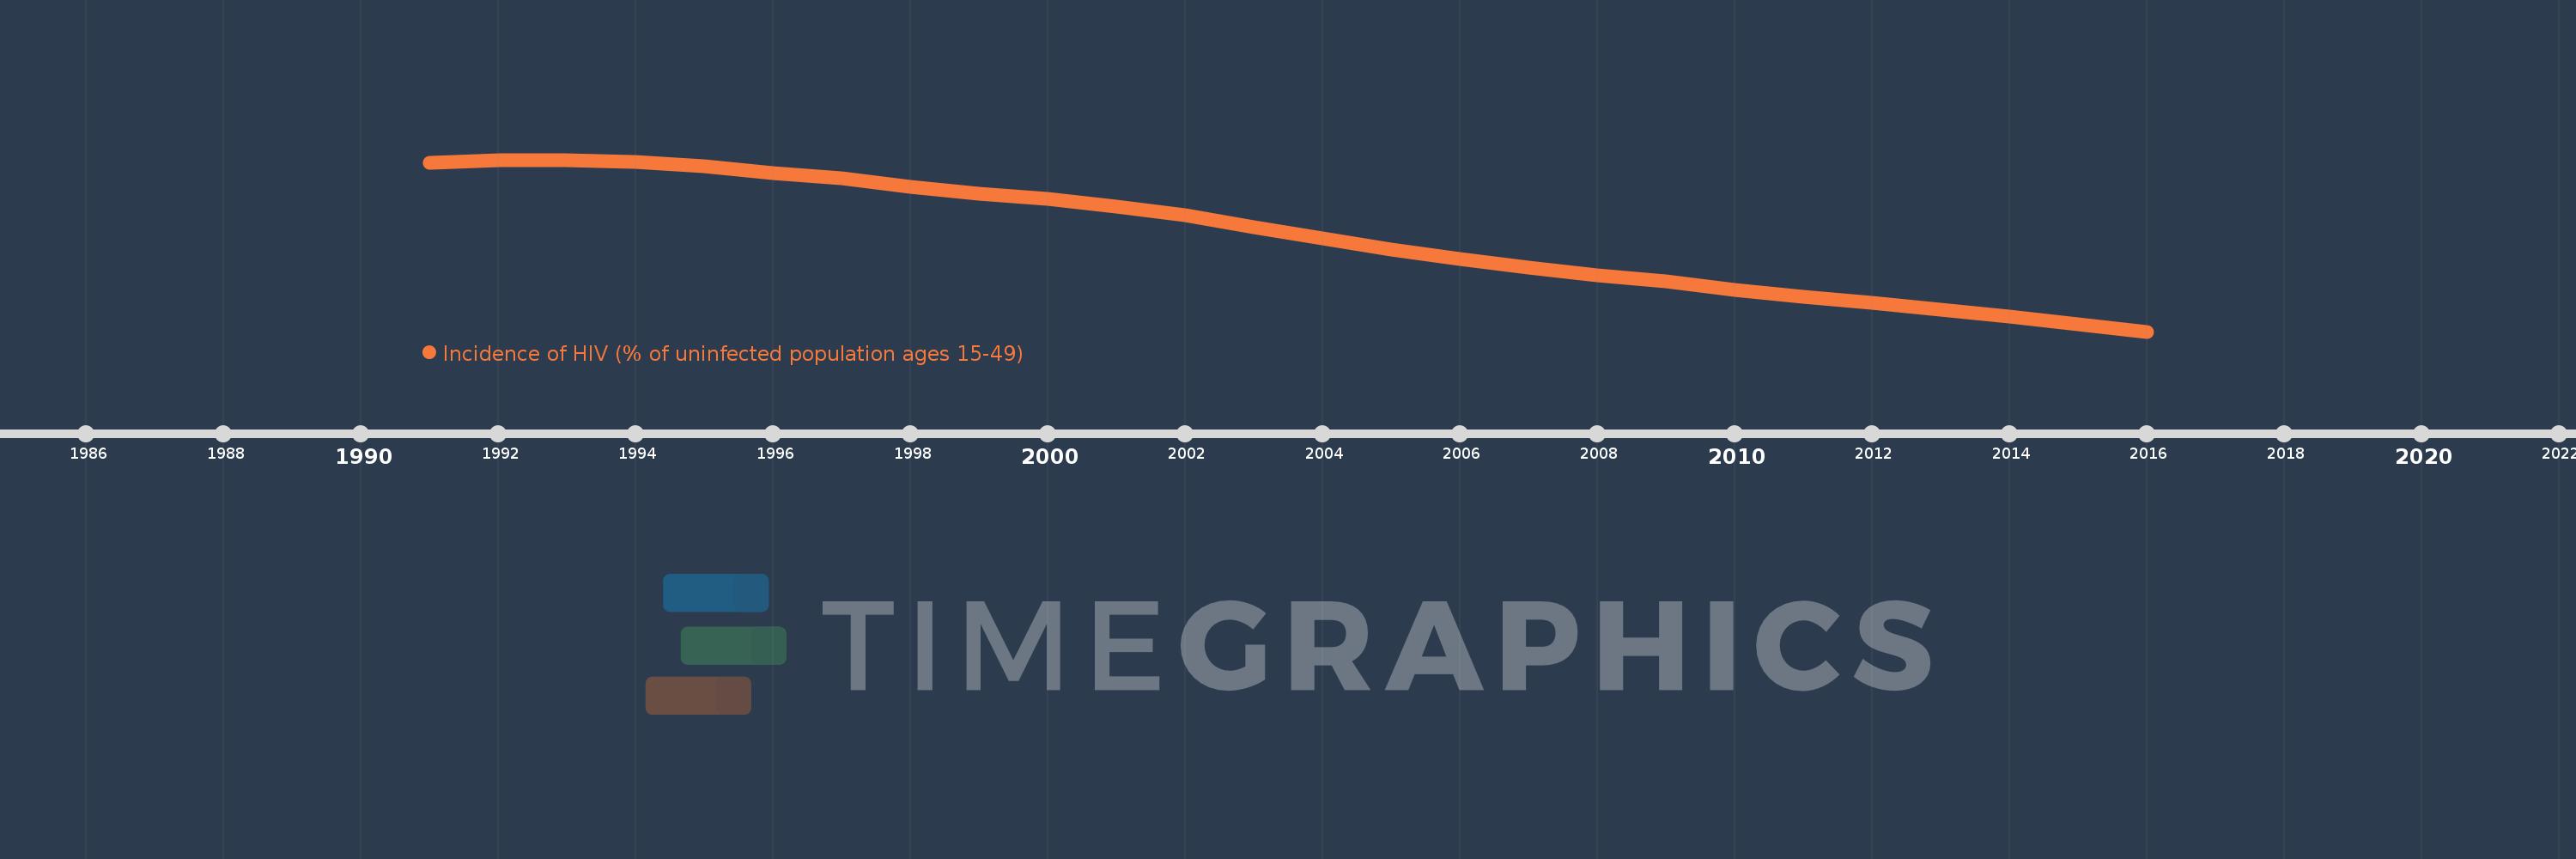
Incidence of HIV (% of uninfected population ages 15-49)
2016,2015,2014,2013,2012,2011,2010,2009,2008,2007,2006,2005,2004,2003,2002,2001,2000,1999,1998,1997,1996,1995,1994,1993,1992,1991
This statistics in other country:
Timeline:
This timeline shows a graph from 1991 to 2016 of Least developed countries: UN classification. No data until 1990. Number of actual observations by date: 26.
Source name:
World Development Indicators
Source organization:
UNAIDS estimates.
Categories, topics:
Health
Last updated:
apr 23, 2017
Indicators value changes by year
At the date of observation
Value
Absolute change
Change from previous value
jan 1, 1991
0.311
+0.311
0.0%
jan 1, 1992
0.315
+0.004
1.28%
jan 1, 1993
0.315
+0.0
0.06%
jan 1, 1994
0.312
-0.003
-1.03%
jan 1, 1995
0.307
-0.005
-1.59%
jan 1, 1996
0.299
-0.008
-2.68%
jan 1, 1997
0.293
-0.006
-1.96%
jan 1, 1998
0.283
-0.01
-3.37%
jan 1, 1999
0.275
-0.008
-2.78%
jan 1, 2000
0.269
-0.006
-2.29%
jan 1, 2001
0.259
-0.01
-3.65%
jan 1, 2002
0.249
-0.01
-3.87%
jan 1, 2003
0.235
-0.014
-5.5%
jan 1, 2004
0.222
-0.014
-5.78%
jan 1, 2005
0.208
-0.014
-6.16%
jan 1, 2006
0.197
-0.011
-5.23%
jan 1, 2007
0.187
-0.01
-5.16%
jan 1, 2008
0.178
-0.009
-4.68%
jan 1, 2009
0.171
-0.007
-4.19%
jan 1, 2010
0.16
-0.01
-6.03%
jan 1, 2011
0.152
-0.008
-5.15%
jan 1, 2012
0.145
-0.007
-4.43%
jan 1, 2013
0.137
-0.008
-5.48%
jan 1, 2014
0.129
-0.008
-5.92%
jan 1, 2015
0.12
-0.009
-6.84%
jan 1, 2016
0.111
-0.009
-7.74%
Ranking of countries by current statistics by years


Comments: