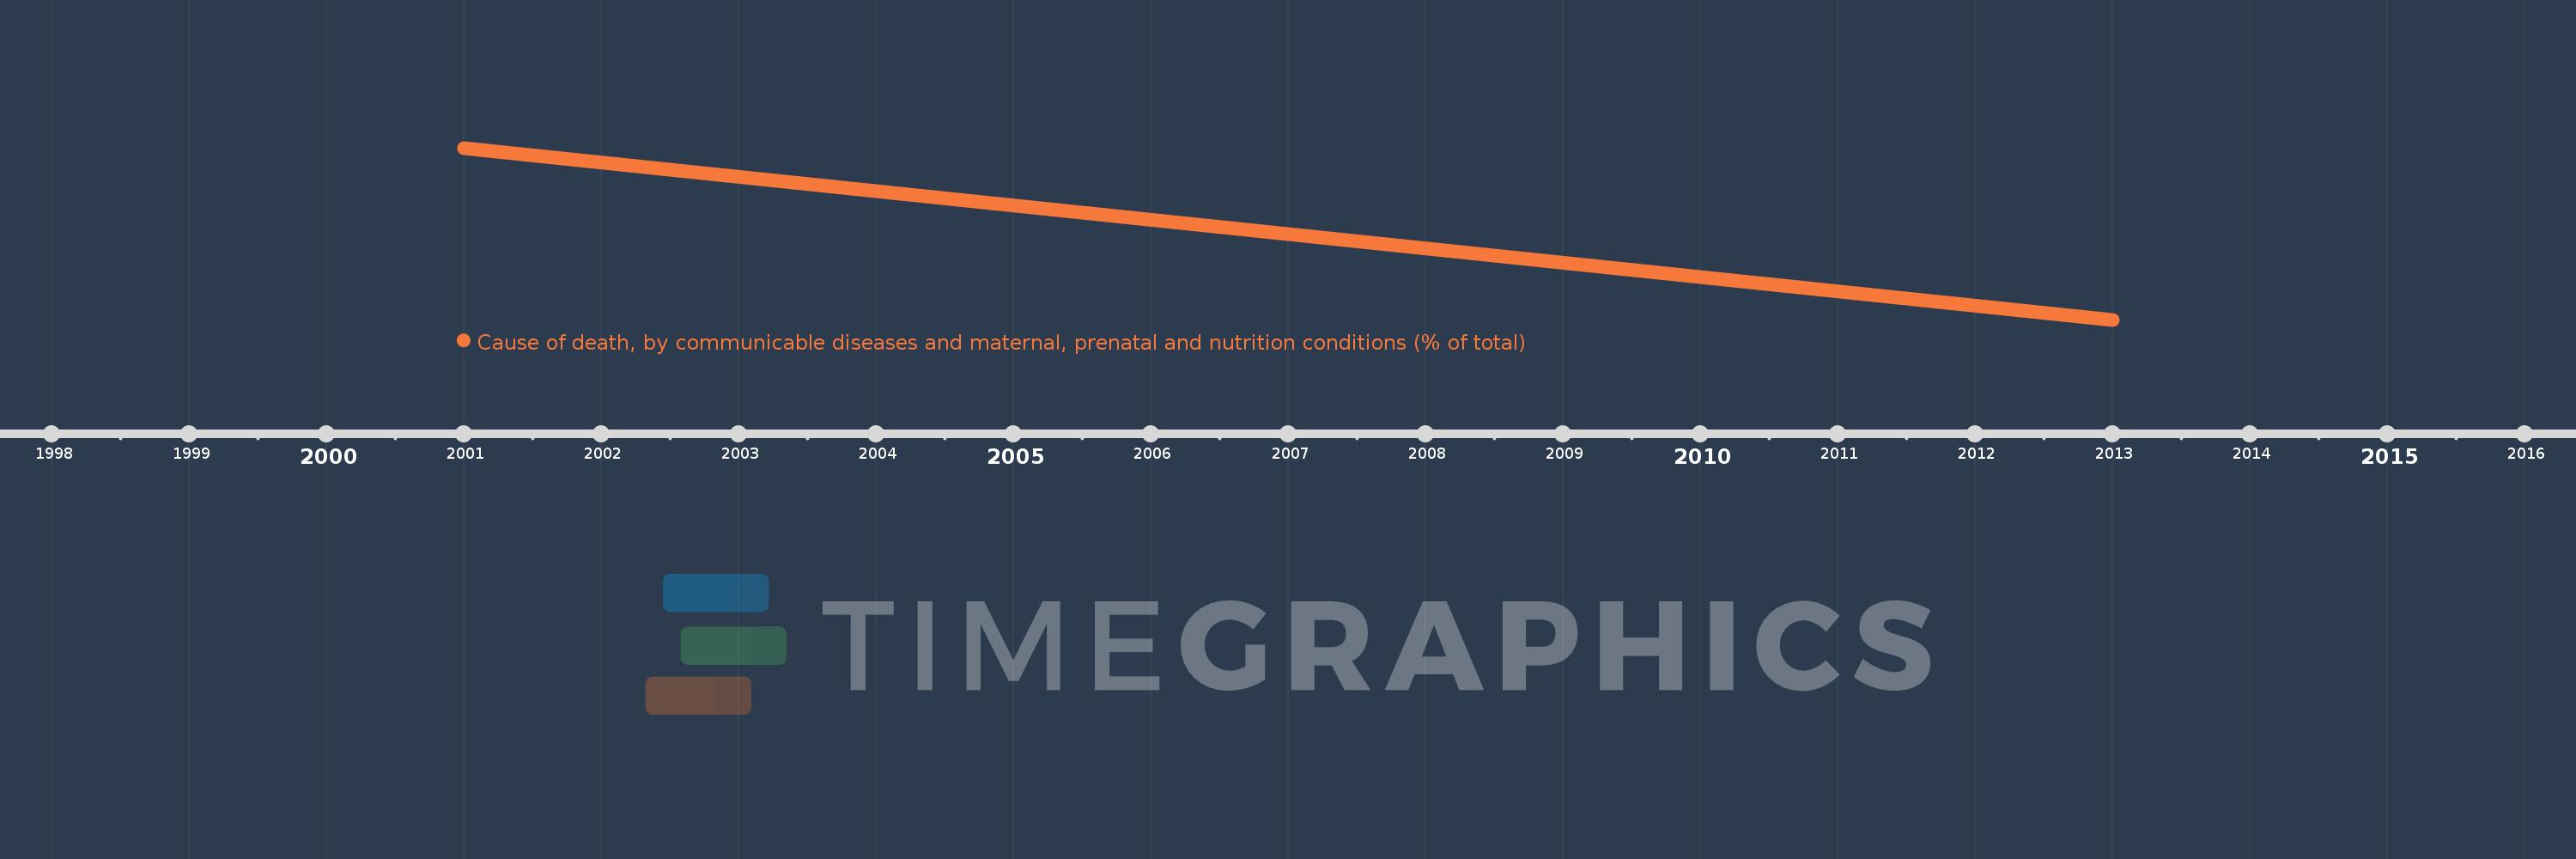
This timeline shows a graph from 2001 to 2013 of Least developed countries: UN classification. No data until 2000. Number of actual observations by date: 2.
Source name:
World Development Indicators
Source organization:
Derived based on the data from WHO's World Health Statistics.
Categories, topics:
Health
Last updated:
apr 23, 2017
Indicators value changes by year
Meaning:
60.278
Minimum:
54.692
jan 1, 2013
Maximum:
65.863
jan 1, 2001
At the date of observation
Value
Absolute change
Change from the previous value
jan 1, 2001
65.863
+65.863
0.0%
jan 1, 2013
54.692
-11.172
-16.96%
Ranking of countries by current statistics by years
