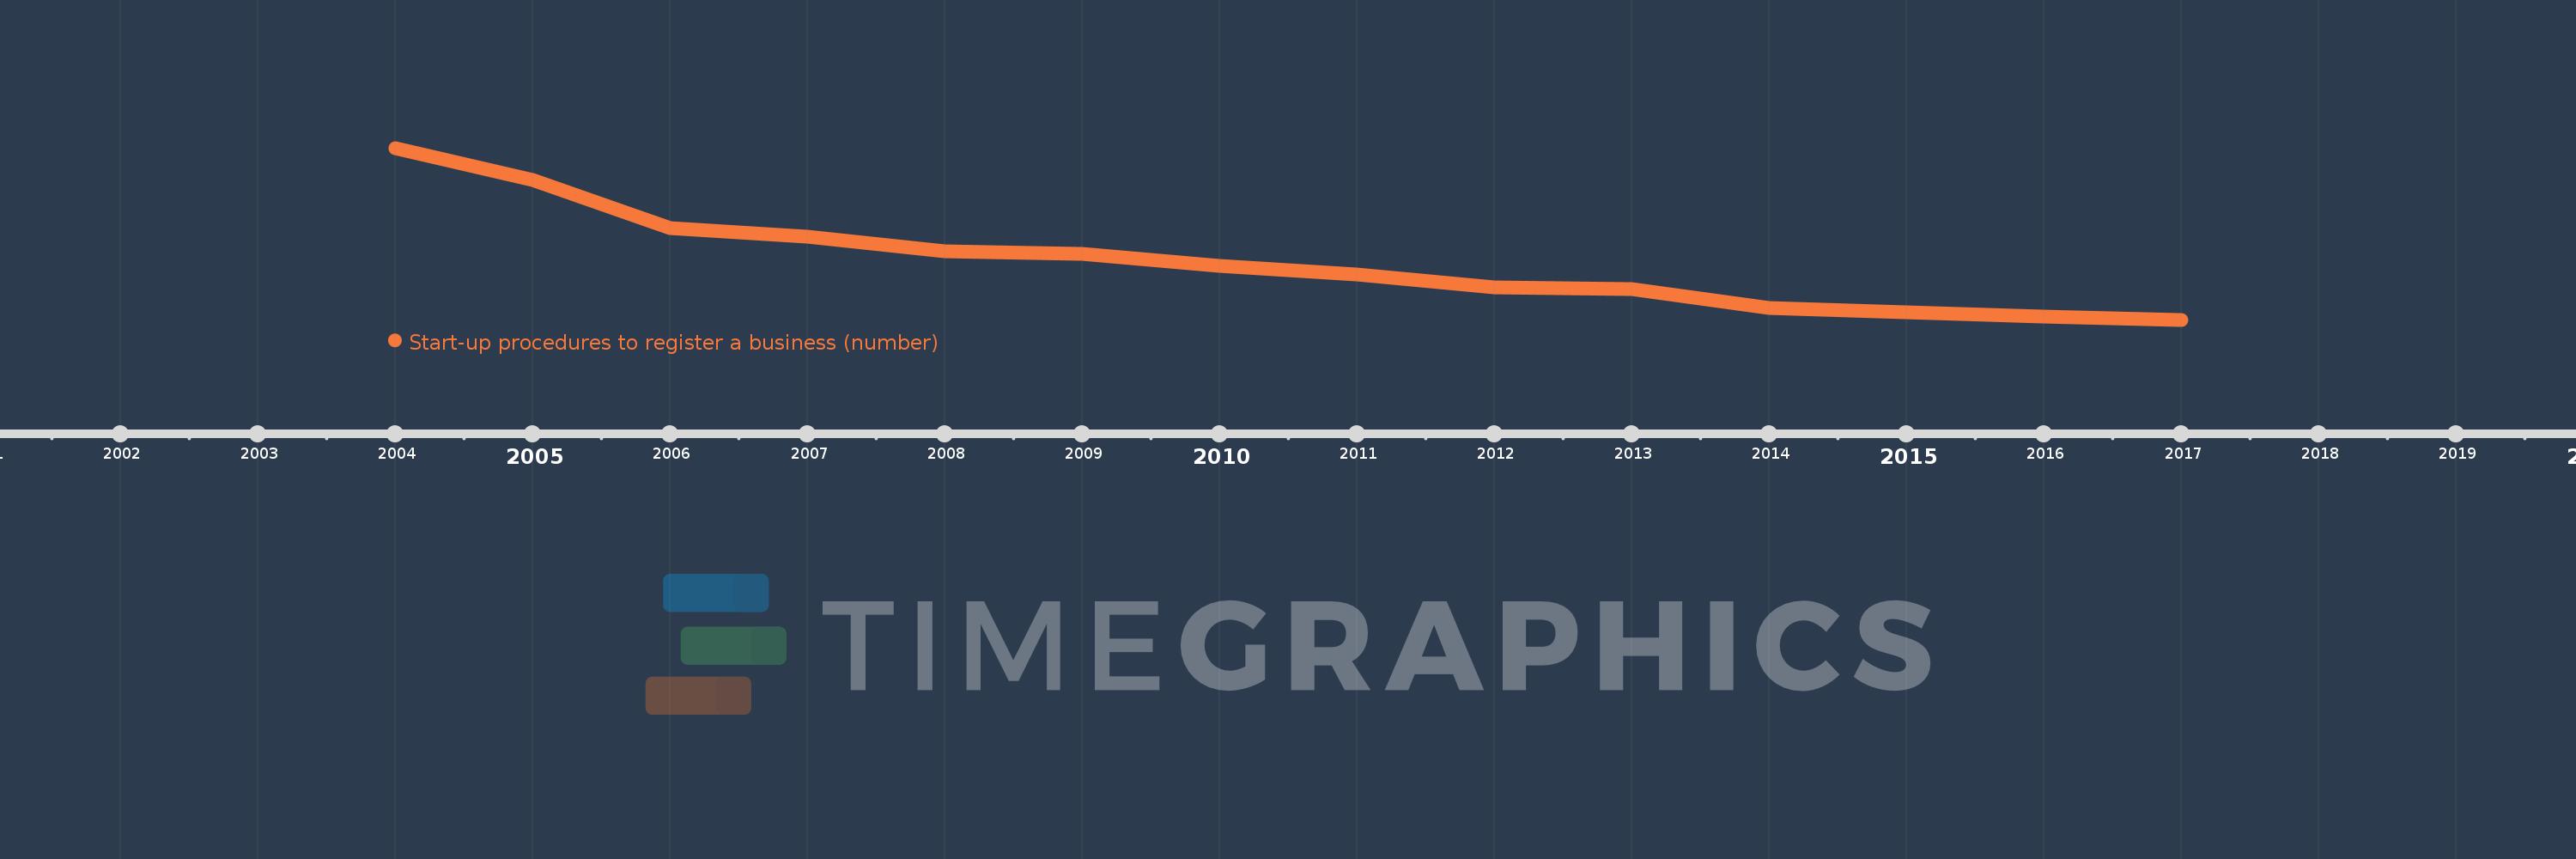
This timeline shows a graph from 2004 to 2017 of Latin America & the Caribbean (IDA & IBRD countries). No data until 2003. Number of actual observations by date: 14.
Source name:
World Development Indicators
Source organization:
World Bank, Doing Business project (http://www.doingbusiness.org/).
Categories, topics:
Private Sector
Last updated:
apr 23, 2017
Indicators value changes by year
Meaning:
9.681
Minimum:
8.367
jan 1, 2017
Maximum:
12.3
jan 1, 2004
At the date of observation
Value
Absolute change
Change from the previous value
jan 1, 2004
12.3
+12.3
0.0%
jan 1, 2005
11.571
-0.729
-5.92%
jan 1, 2006
10.467
-1.105
-9.55%
jan 1, 2007
10.267
-0.2
-1.91%
jan 1, 2008
9.933
-0.333
-3.25%
jan 1, 2009
9.867
-0.067
-0.67%
jan 1, 2010
9.6
-0.267
-2.7%
jan 1, 2011
9.4
-0.2
-2.08%
jan 1, 2012
9.1
-0.3
-3.19%
jan 1, 2013
9.067
-0.033
-0.37%
jan 1, 2014
8.633
-0.433
-4.78%
jan 1, 2015
8.533
-0.1
-1.16%
jan 1, 2016
8.433
-0.1
-1.17%
jan 1, 2017
8.367
-0.067
-0.79%
Ranking of countries by current statistics by years
