30
/
AIzaSyAYiBZKx7MnpbEhh9jyipgxe19OcubqV5w
April 1, 2024
43280
Latin America & the Caribbean (IDA & IBRD countries)
TLA
false
2
1
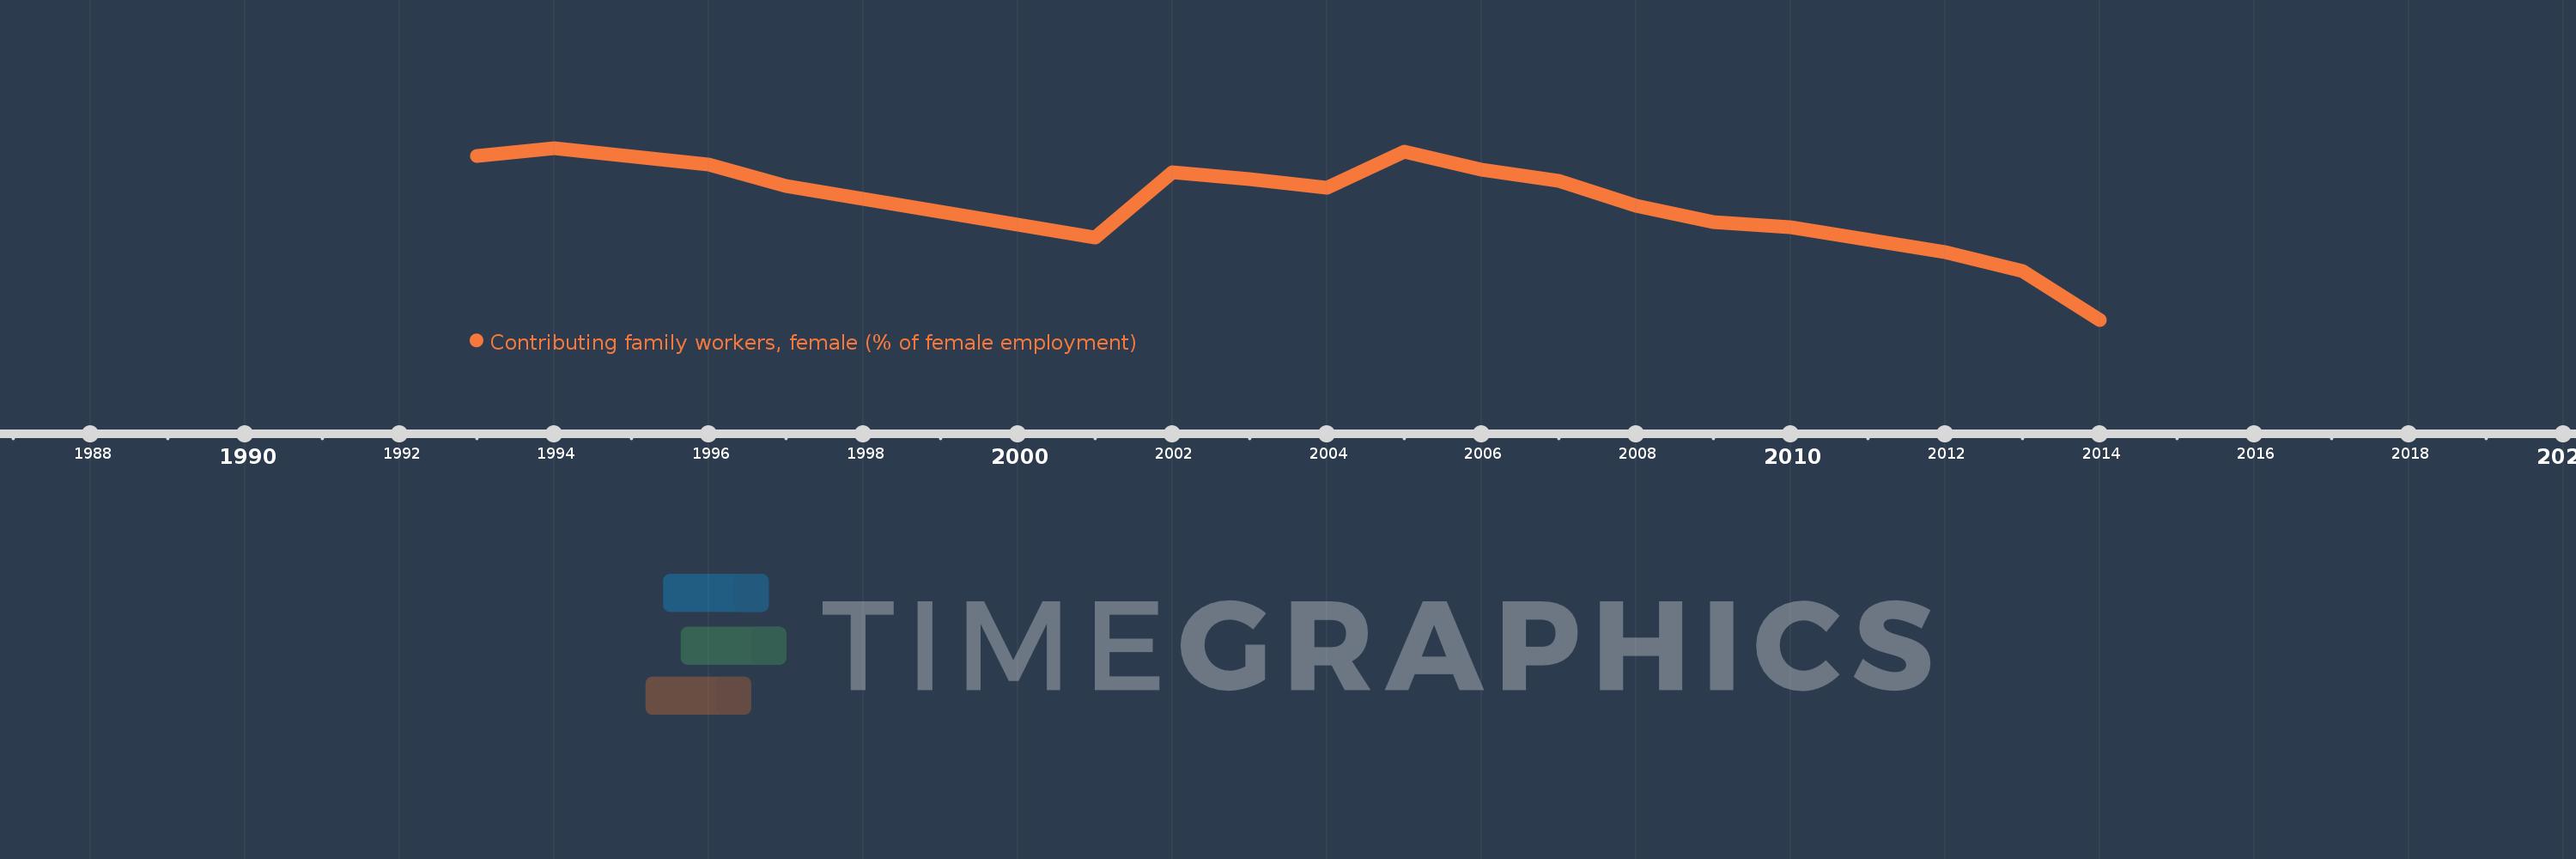
Contributing family workers, female (% of female employment)
2014,2013,2012,2010,2009,2008,2007,2006,2005,2004,2003,2002,2001,1997,1996,1994,1993
