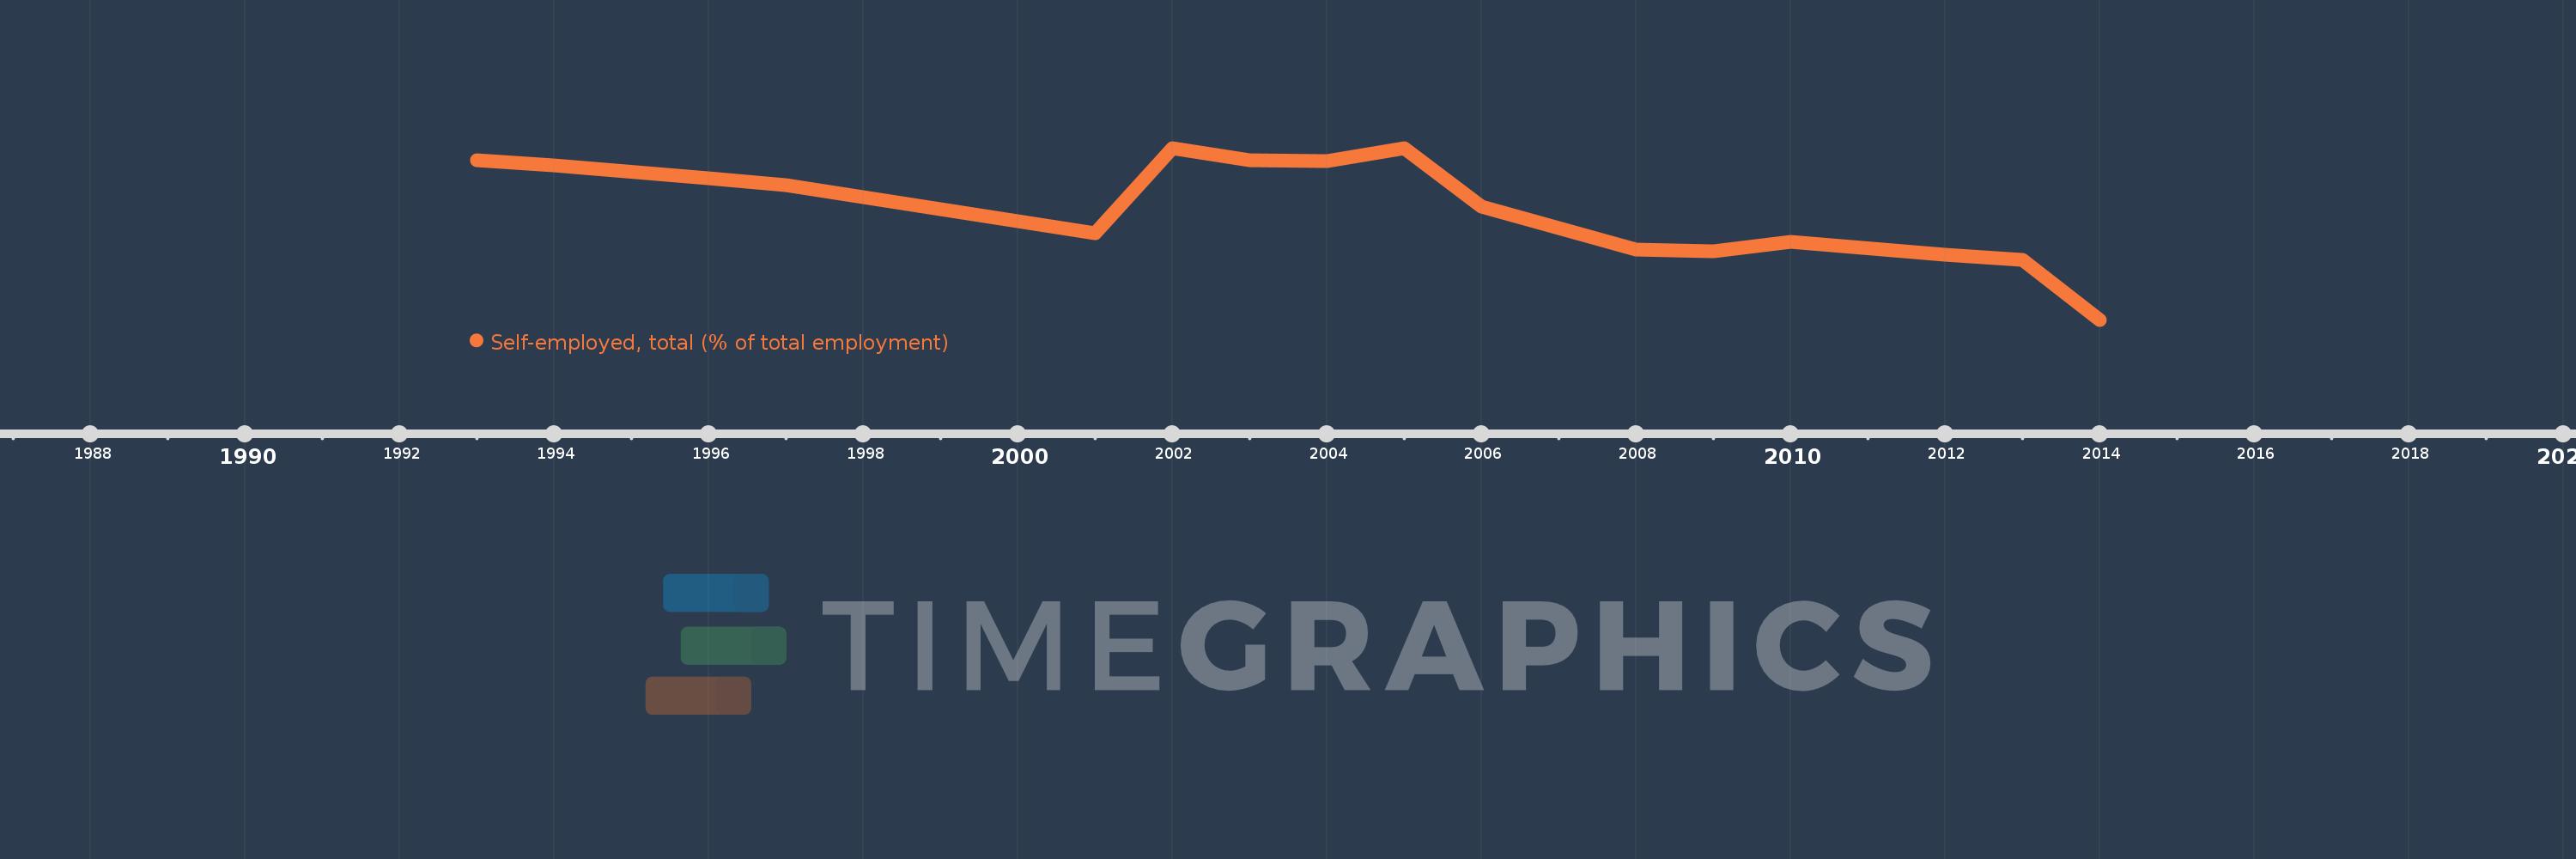
This timeline shows a graph from 1993 to 2014 of Latin America & Caribbean (excluding high income). No data until 1992. Number of actual observations by date: 17.
Source name:
World Development Indicators
Source organization:
International Labour Organization, Key Indicators of the Labour Market database.
Categories, topics:
Social Protection & Labor
Last updated:
apr 23, 2017
Indicators value changes by year
Meaning:
37.26
Minimum:
32.363
jan 1, 2014
Maximum:
39.95
jan 1, 2002
At the date of observation
Value
Absolute change
Change from the previous value
jan 1, 1993
39.405
+39.405
0.0%
jan 1, 1994
39.195
-0.21
-0.53%
jan 1, 1996
38.607
-0.588
-1.5%
jan 1, 1997
38.3
-0.308
-0.8%
jan 1, 2001
36.177
-2.122
-5.54%
jan 1, 2002
39.95
+3.772
10.43%
jan 1, 2003
39.413
-0.537
-1.34%
jan 1, 2004
39.378
-0.035
-0.09%
jan 1, 2005
39.939
+0.561
1.43%
jan 1, 2006
37.353
-2.586
-6.48%
jan 1, 2007
36.422
-0.931
-2.49%
jan 1, 2008
35.479
-0.943
-2.59%
jan 1, 2009
35.395
-0.084
-0.24%
jan 1, 2010
35.804
+0.409
1.16%
jan 1, 2012
35.246
-0.558
-1.56%
jan 1, 2013
34.997
-0.249
-0.71%
jan 1, 2014
32.363
-2.634
-7.53%
Ranking of countries by current statistics by years
