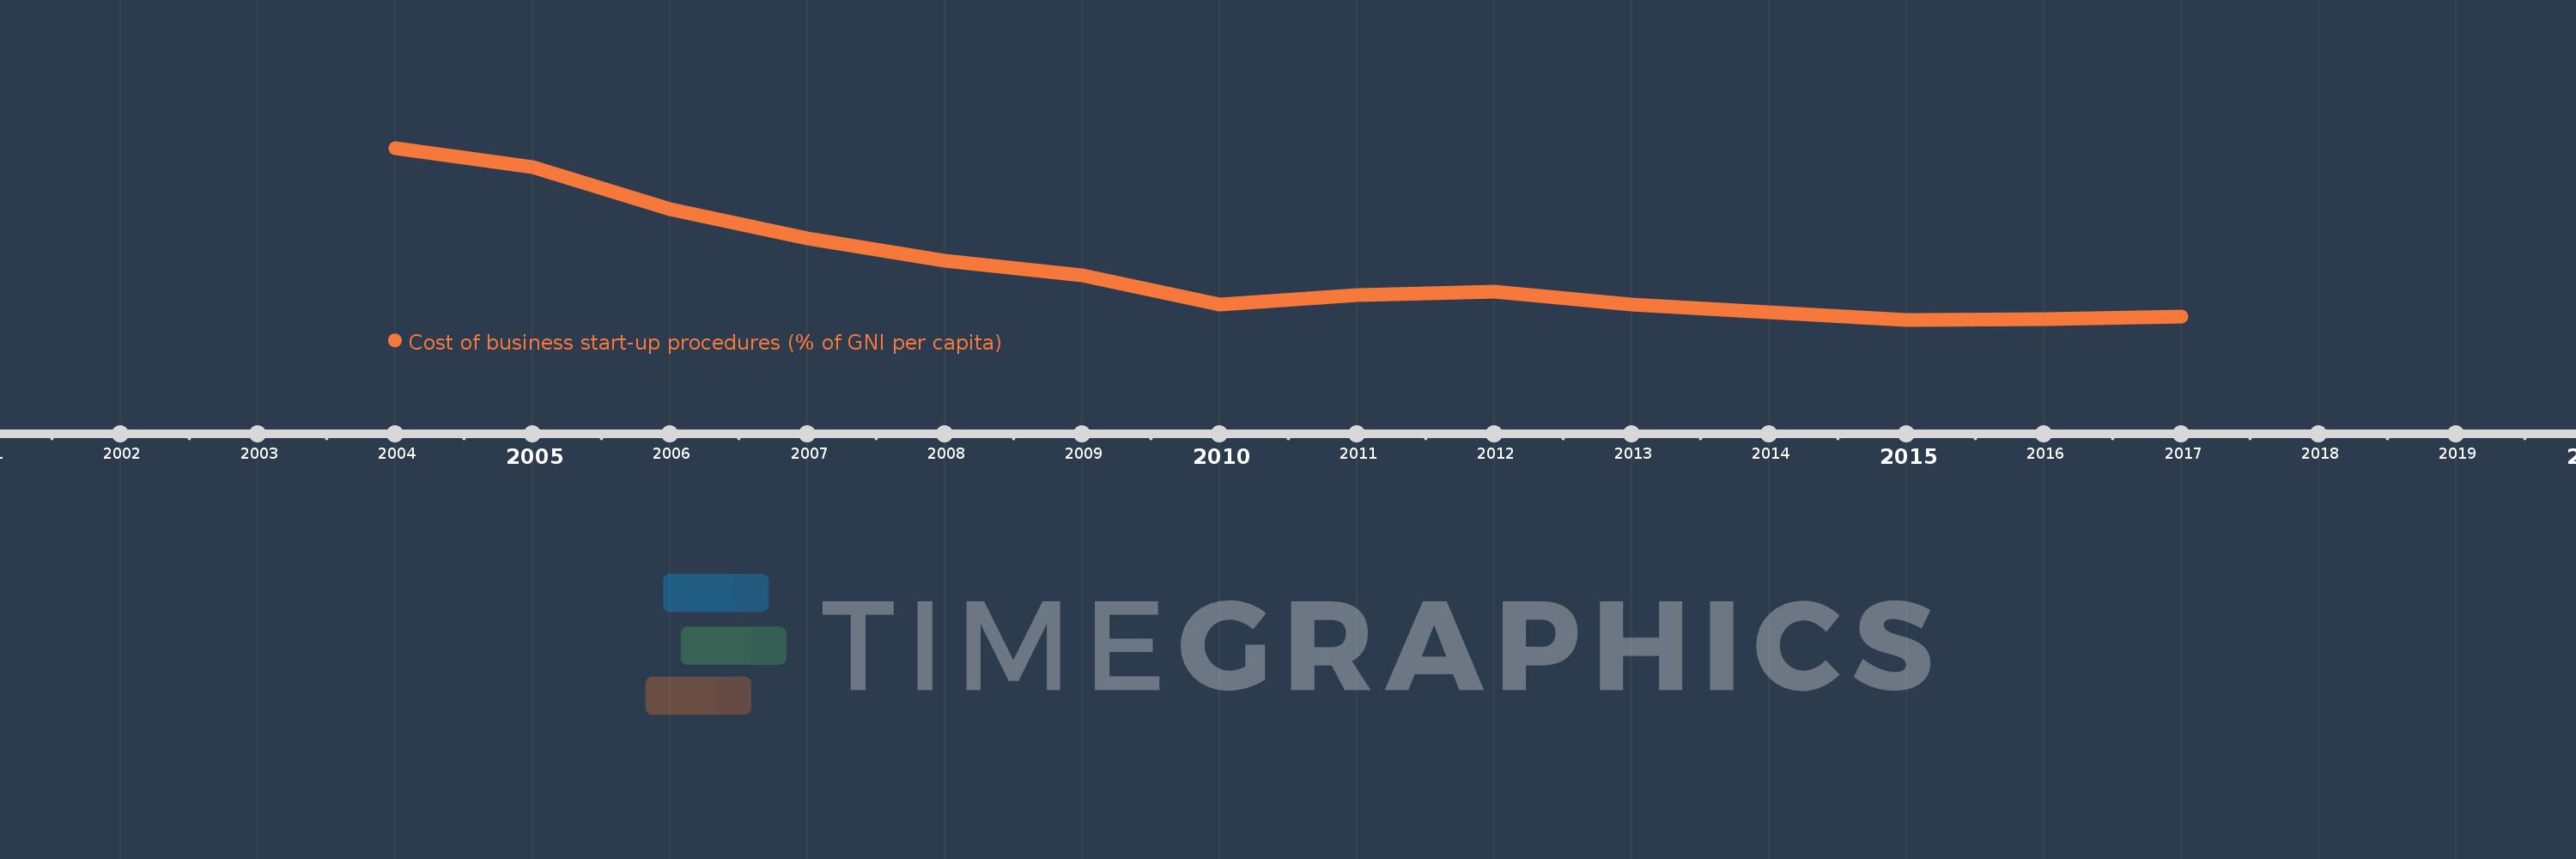
This timeline shows a graph from 2004 to 2017 of Latin America & Caribbean (excluding high income). No data until 2003. Number of actual observations by date: 14.
Source name:
World Development Indicators
Source organization:
World Bank, Doing Business project (http://www.doingbusiness.org/).
Categories, topics:
Private Sector
Last updated:
apr 23, 2017
Indicators value changes by year
Meaning:
50.06
Minimum:
36.992
jan 1, 2015
Maximum:
80.978
jan 1, 2004
At the date of observation
Value
Absolute change
Change from the previous value
jan 1, 2004
80.978
+80.978
0.0%
jan 1, 2005
76.021
-4.957
-6.12%
jan 1, 2006
65.312
-10.709
-14.09%
jan 1, 2007
57.856
-7.456
-11.42%
jan 1, 2008
52.096
-5.76
-9.96%
jan 1, 2009
48.468
-3.628
-6.96%
jan 1, 2010
40.78
-7.688
-15.86%
jan 1, 2011
43.308
+2.528
6.2%
jan 1, 2012
44.172
+0.864
2.0%
jan 1, 2013
40.98
-3.192
-7.23%
jan 1, 2014
38.904
-2.076
-5.07%
jan 1, 2015
36.992
-1.912
-4.91%
jan 1, 2016
37.168
+0.176
0.48%
jan 1, 2017
37.812
+0.644
1.73%
Ranking of countries by current statistics by years
