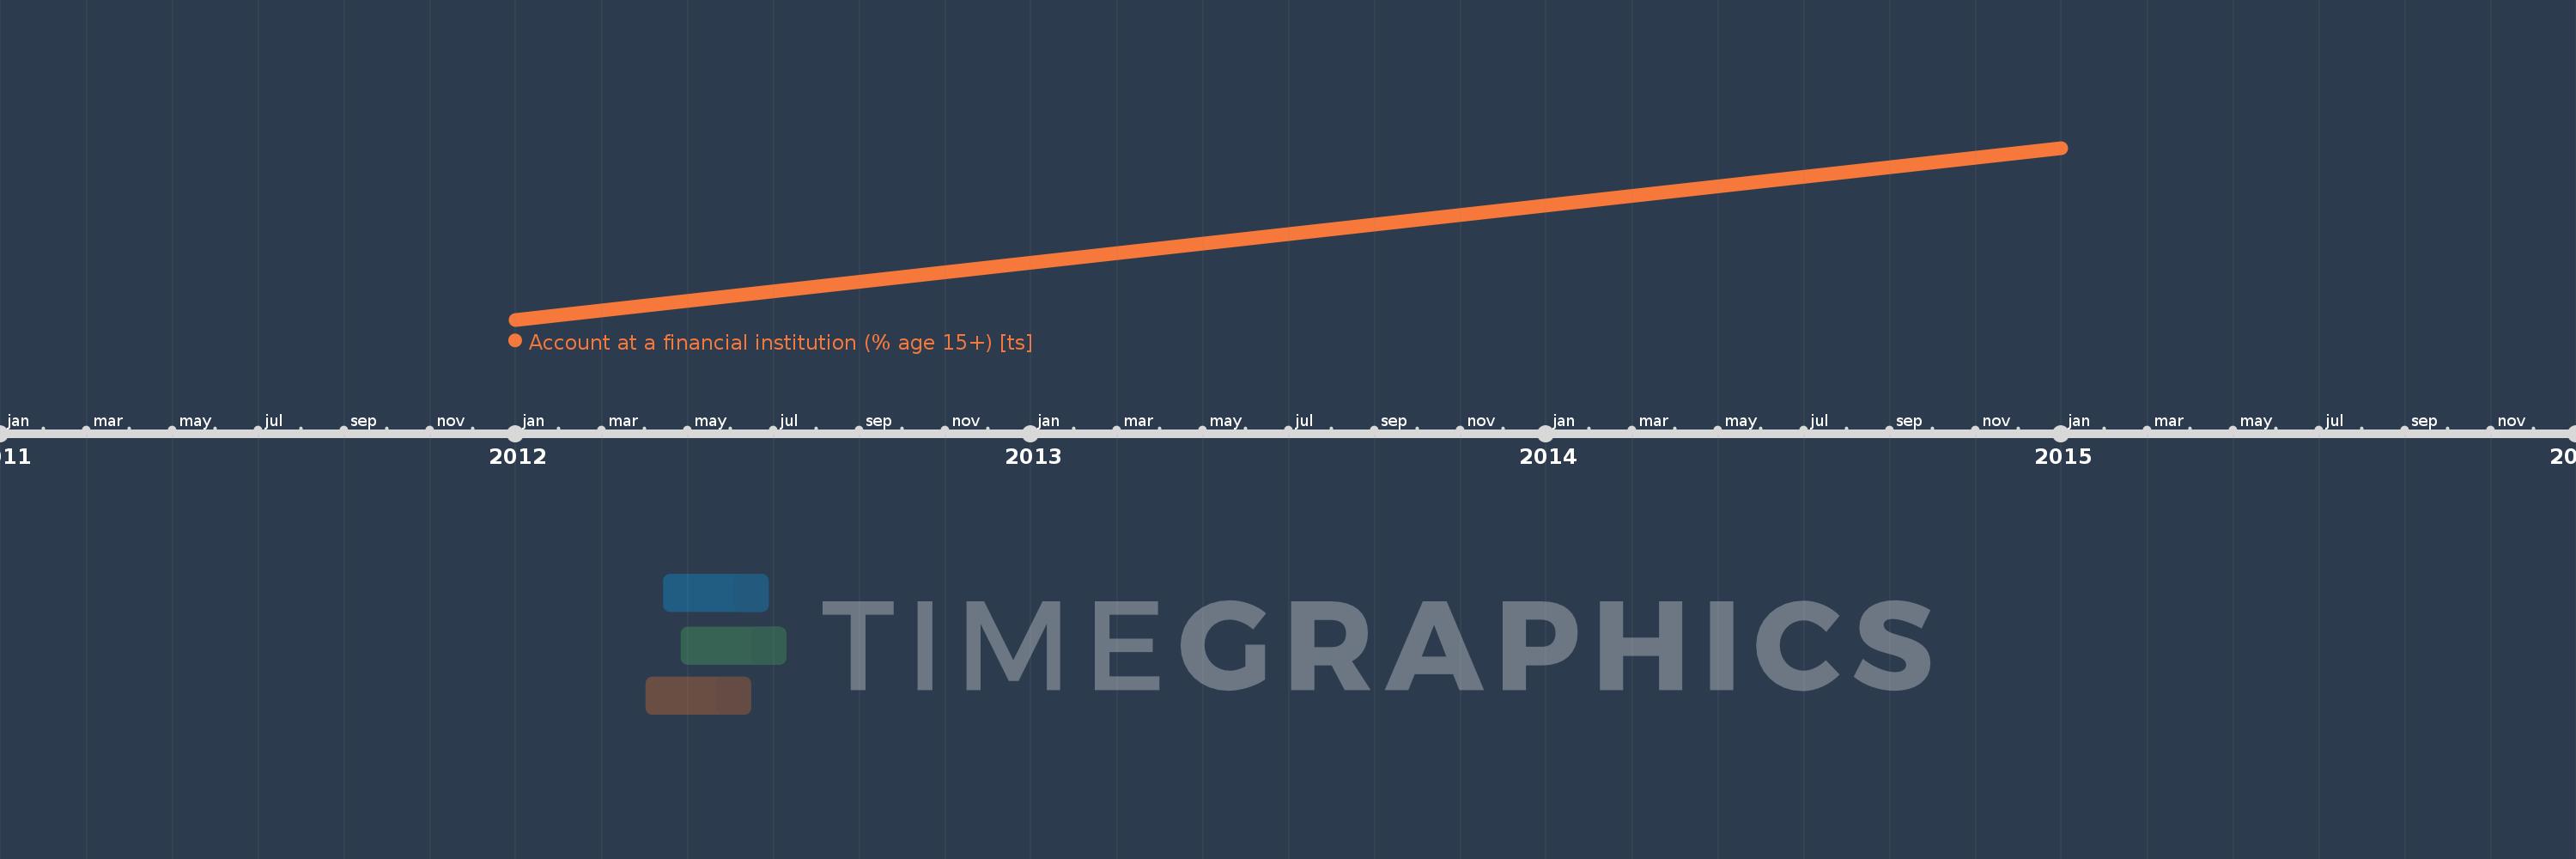
This timeline shows a graph from 2012 to 2015 of Latin America & Caribbean (excluding high income). No data until 2011. Number of actual observations by date: 2.
Source name:
World Development Indicators
Source organization:
Demirguc-Kunt et al., 2015
Categories, topics:
Financial Sector
Last updated:
apr 23, 2017
Indicators value changes by year
Meaning:
45.2
Minimum:
39.256
jan 1, 2012
Maximum:
51.143
jan 1, 2015
At the date of observation
Value
Absolute change
Change from the previous value
jan 1, 2012
39.256
+39.256
0.0%
jan 1, 2015
51.143
+11.887
30.28%
Ranking of countries by current statistics by years
