29
/
en
AIzaSyAYiBZKx7MnpbEhh9jyipgxe19OcubqV5w
April 1, 2024
41631
Latin America & Caribbean
LCN
false
2
1
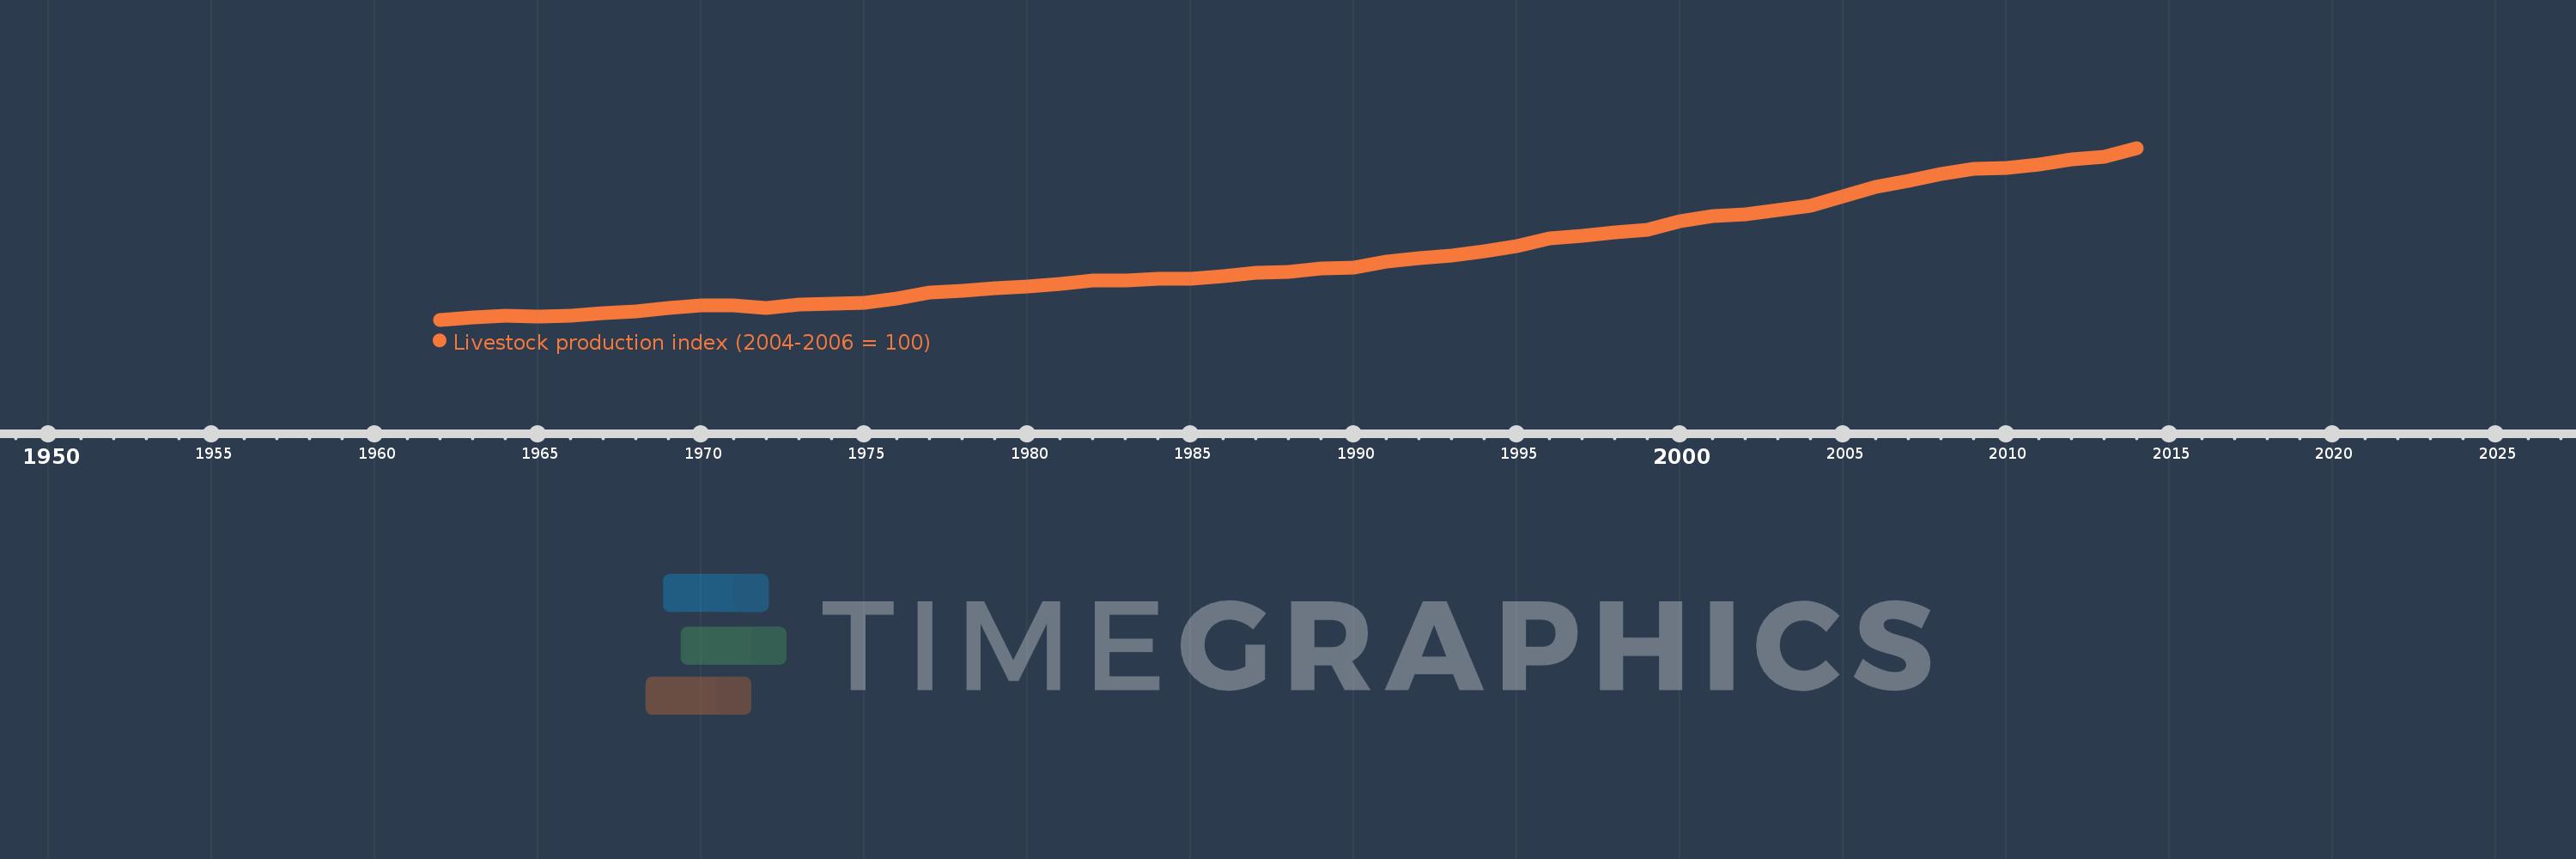
Livestock production index (2004-2006 = 100)
2014,2013,2012,2011,2010,2009,2008,2007,2006,2005,2004,2003,2002,2001,2000,1999,1998,1997,1996,1995,1994,1993,1992,1991,1990,1989,1988,1987,1986,1985,1984,1983,1982,1981,1980,1979,1978,1977,1976,1975,1974,1973,1972,1971,1970,1969,1968,1967,1966,1965,1964,1963,1962
This statistics in other country:
AfghanistanAlbaniaAlgeriaAmerican SamoaAngolaAntigua and BarbudaArab WorldArgentinaArmeniaAustraliaAustriaAzerbaijanBahamas, TheBahrainBangladeshBarbadosBelarusBelgiumBelizeBeninBermudaBhutanBoliviaBosnia and HerzegovinaBotswanaBrazilBritish Virgin IslandsBrunei DarussalamBulgariaBurkina FasoBurundiCabo VerdeCambodiaCameroonCanadaCaribbean small statesCayman IslandsCentral African RepublicCentral Europe and the BalticsChadChileChinaColombiaComorosCongo, Dem. Rep.Congo, Rep.Costa RicaCote d'IvoireCroatiaCubaCyprusCzech RepublicDenmarkDjiboutiDominicaDominican RepublicEarly-demographic dividendEast Asia & PacificEast Asia & Pacific (excluding high income)East Asia & Pacific (IDA & IBRD countries)EcuadorEgypt, Arab Rep.El SalvadorEquatorial GuineaEritreaEstoniaEthiopiaEuro areaEurope & Central AsiaEurope & Central Asia (excluding high income)Europe & Central Asia (IDA & IBRD countries)European UnionFaroe IslandsFijiFinlandFragile and conflict affected situationsFranceFrench PolynesiaGabonGambia, TheGeorgiaGermanyGhanaGreeceGreenlandGrenadaGuamGuatemalaGuineaGuinea-BissauGuyanaHaitiHeavily indebted poor countries (HIPC)High incomeHondurasHong Kong SAR, ChinaHungaryIBRD onlyIcelandIDA & IBRD totalIDA blendIDA onlyIDA totalIndiaIndonesiaIran, Islamic Rep.IraqIrelandIsraelItalyJamaicaJapanJordanKazakhstanKenyaKiribatiKorea, Dem. People’s Rep.Korea, Rep.KuwaitKyrgyz RepublicLao PDRLate-demographic dividendLatin America & Caribbean Latin America & Caribbean (excluding high income)Latin America & the Caribbean (IDA & IBRD countries)LatviaLeast developed countries: UN classificationLebanonLesothoLiberiaLibyaLiechtensteinLithuaniaLow & middle incomeLow incomeLower middle incomeLuxembourgMacao SAR, ChinaMacedonia, FYRMadagascarMalawiMalaysiaMaldivesMaliMaltaMauritaniaMauritiusMexicoMicronesia, Fed. Sts.Middle East & North AfricaMiddle East & North Africa (excluding high income)Middle East & North Africa (IDA & IBRD countries)Middle incomeMoldovaMongoliaMontenegroMoroccoMozambiqueMyanmarNamibiaNauruNepalNetherlandsNew CaledoniaNew ZealandNicaraguaNigerNigeriaNorth AmericaNorwayOECD membersOmanOther small statesPacific island small statesPakistanPanamaPapua New GuineaParaguayPeruPhilippinesPolandPortugalPost-demographic dividendPre-demographic dividendPuerto RicoQatarRomaniaRussian FederationRwandaSamoaSao Tome and PrincipeSaudi ArabiaSenegalSerbiaSeychellesSierra LeoneSingaporeSlovak RepublicSloveniaSmall statesSolomon IslandsSomaliaSouth AfricaSouth AsiaSouth Asia (IDA & IBRD)SpainSri LankaSt. Kitts and NevisSt. LuciaSt. Vincent and the GrenadinesSub-Saharan Africa Sub-Saharan Africa (excluding high income)Sub-Saharan Africa (IDA & IBRD countries)SudanSurinameSwazilandSwedenSwitzerlandSyrian Arab RepublicTajikistanTanzaniaThailandTimor-LesteTogoTongaTrinidad and TobagoTunisiaTurkeyTurkmenistanTuvaluUgandaUkraineUnited Arab EmiratesUnited KingdomUnited StatesUpper middle incomeUruguayUzbekistanVanuatuVenezuela, RBVietnamVirgin Islands (U.S.)West Bank and GazaWorldYemen, Rep.ZambiaZimbabwe Timeline:
This timeline shows a graph from 1962 to 2014 of Latin America & Caribbean . No data until 1961. Number of actual observations by date: 53.
Source name:
World Development Indicators
Source organization:
Food and Agriculture Organization, electronic files and web site.
Categories, topics:
Agriculture & Rural Development
Last updated:
apr 23, 2017
Indicators value changes by year
Minimum:
24.874
jan 1, 1962
Maximum:
122.759
jan 1, 2014
At the date of observation
Value
Absolute change
Change from previous value
jan 1, 1962
24.874
+24.874
0.0%
jan 1, 1963
26.057
+1.183
4.76%
jan 1, 1964
27.04
+0.984
3.77%
jan 1, 1965
26.531
-0.509
-1.88%
jan 1, 1966
27.236
+0.705
2.66%
jan 1, 1967
28.69
+1.454
5.34%
jan 1, 1968
29.598
+0.908
3.17%
jan 1, 1969
31.349
+1.75
5.91%
jan 1, 1970
33.145
+1.796
5.73%
jan 1, 1971
33.135
-0.01
-0.03%
jan 1, 1972
31.677
-1.457
-4.4%
jan 1, 1973
33.517
+1.84
5.81%
jan 1, 1974
33.82
+0.303
0.9%
jan 1, 1975
34.647
+0.827
2.45%
jan 1, 1976
37.201
+2.554
7.37%
jan 1, 1977
40.377
+3.176
8.54%
jan 1, 1978
41.142
+0.766
1.9%
jan 1, 1979
42.997
+1.854
4.51%
jan 1, 1980
43.647
+0.65
1.51%
jan 1, 1981
45.489
+1.842
4.22%
jan 1, 1982
47.272
+1.783
3.92%
jan 1, 1983
47.3
+0.027
0.06%
jan 1, 1984
48.105
+0.806
1.7%
jan 1, 1985
48.132
+0.027
0.06%
jan 1, 1986
49.741
+1.608
3.34%
jan 1, 1987
51.849
+2.109
4.24%
jan 1, 1988
52.328
+0.479
0.92%
jan 1, 1989
53.897
+1.569
3.0%
jan 1, 1990
54.816
+0.919
1.7%
jan 1, 1991
57.843
+3.028
5.52%
jan 1, 1992
60.047
+2.204
3.81%
jan 1, 1993
61.394
+1.347
2.24%
jan 1, 1994
64.07
+2.676
4.36%
jan 1, 1995
66.945
+2.875
4.49%
jan 1, 1996
71.146
+4.201
6.28%
jan 1, 1997
72.835
+1.689
2.37%
jan 1, 1998
74.814
+1.979
2.72%
jan 1, 1999
76.113
+1.299
1.74%
jan 1, 2000
80.789
+4.676
6.14%
jan 1, 2001
83.81
+3.021
3.74%
jan 1, 2002
84.902
+1.092
1.3%
jan 1, 2003
87.551
+2.649
3.12%
jan 1, 2004
89.798
+2.247
2.57%
jan 1, 2005
95.394
+5.596
6.23%
jan 1, 2006
100.389
+4.995
5.24%
jan 1, 2007
104.218
+3.829
3.81%
jan 1, 2008
107.849
+3.631
3.48%
jan 1, 2009
110.734
+2.886
2.68%
jan 1, 2010
111.339
+0.604
0.55%
jan 1, 2011
113.239
+1.901
1.71%
jan 1, 2012
116.166
+2.926
2.58%
jan 1, 2013
117.934
+1.768
1.52%
jan 1, 2014
122.759
+4.826
4.09%
Ranking of countries by current statistics by years


Comments: