29
/
en
AIzaSyAYiBZKx7MnpbEhh9jyipgxe19OcubqV5w
April 1, 2024
35869
High income
HIC
false
2
1
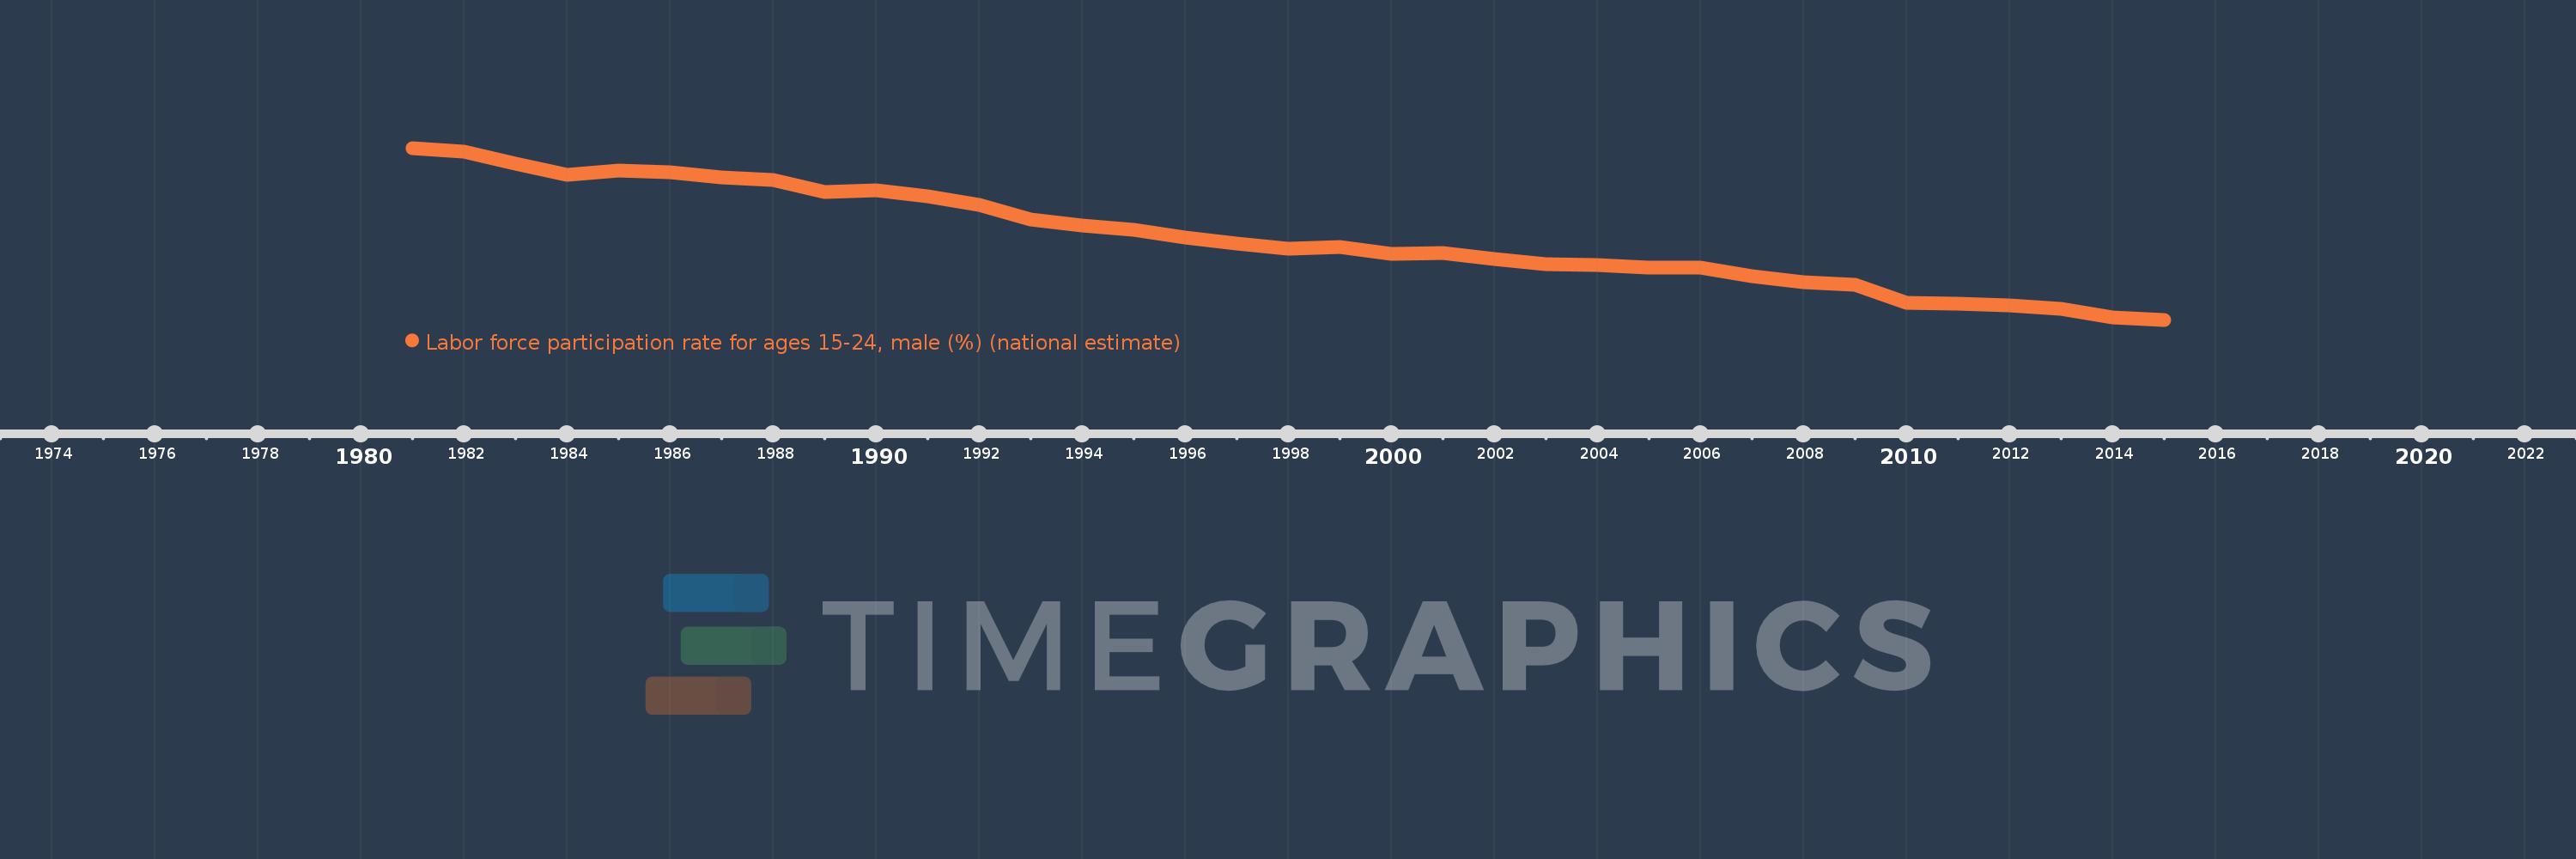
Labor force participation rate for ages 15-24, male (%) (national estimate)
2015,2014,2013,2012,2011,2010,2009,2008,2007,2006,2005,2004,2003,2002,2001,2000,1999,1998,1997,1996,1995,1994,1993,1992,1991,1990,1989,1988,1987,1986,1985,1984,1983,1982,1981
This statistics in other country:
AlbaniaAlgeriaAmerican SamoaAntigua and BarbudaArgentinaArmeniaArubaAustraliaAustriaAzerbaijanBahamas, TheBahrainBangladeshBarbadosBelarusBelgiumBelizeBeninBermudaBhutanBoliviaBosnia and HerzegovinaBotswanaBrazilBritish Virgin IslandsBrunei DarussalamBulgariaBurkina FasoBurundiCabo VerdeCambodiaCameroonCanadaCaribbean small statesCayman IslandsCentral African RepublicCentral Europe and the BalticsChadChileColombiaComorosCongo, Dem. Rep.Congo, Rep.Costa RicaCote d'IvoireCroatiaCubaCyprusCzech RepublicDenmarkDjiboutiDominicaDominican RepublicEarly-demographic dividendEcuadorEgypt, Arab Rep.El SalvadorEquatorial GuineaEstoniaEthiopiaEuro areaEurope & Central AsiaEurope & Central Asia (excluding high income)Europe & Central Asia (IDA & IBRD countries)European UnionFijiFinlandFranceFrench PolynesiaGabonGambia, TheGeorgiaGermanyGhanaGibraltarGreeceGrenadaGuamGuatemalaGuineaGuyanaHaitiHigh incomeHondurasHong Kong SAR, ChinaHungaryIcelandIDA blendIndiaIndonesiaIran, Islamic Rep.IraqIrelandIsle of ManIsraelItalyJamaicaJapanJordanKazakhstanKenyaKiribatiKorea, Rep.KosovoKuwaitKyrgyz RepublicLao PDRLatin America & Caribbean Latin America & Caribbean (excluding high income)Latin America & the Caribbean (IDA & IBRD countries)LatviaLebanonLesothoLiberiaLibyaLiechtensteinLithuaniaLower middle incomeLuxembourgMacao SAR, ChinaMacedonia, FYRMadagascarMalawiMalaysiaMaldivesMaliMaltaMauritiusMexicoMiddle East & North AfricaMiddle East & North Africa (excluding high income)Middle East & North Africa (IDA & IBRD countries)MoldovaMonacoMongoliaMontenegroMoroccoMozambiqueMyanmarNamibiaNauruNepalNetherlandsNew ZealandNicaraguaNigerNigeriaNorth AmericaNorthern Mariana IslandsNorwayOECD membersOmanPakistanPalauPanamaPapua New GuineaParaguayPeruPhilippinesPolandPortugalPost-demographic dividendPuerto RicoQatarRomaniaRussian FederationRwandaSamoaSan MarinoSao Tome and PrincipeSaudi ArabiaSenegalSerbiaSeychellesSierra LeoneSingaporeSlovak RepublicSloveniaSolomon IslandsSouth AfricaSouth AsiaSouth Asia (IDA & IBRD)South SudanSpainSri LankaSt. Kitts and NevisSt. LuciaSt. Vincent and the GrenadinesSudanSurinameSwazilandSwedenSwitzerlandSyrian Arab RepublicTajikistanTanzaniaThailandTimor-LesteTogoTongaTrinidad and TobagoTunisiaTurkeyTurks and Caicos IslandsUgandaUkraineUnited Arab EmiratesUnited KingdomUnited StatesUruguayVanuatuVenezuela, RBVietnamVirgin Islands (U.S.)West Bank and GazaYemen, Rep.ZambiaZimbabwe Timeline:
This timeline shows a graph from 1981 to 2015 of High income. No data until 1980. Number of actual observations by date: 35.
Source name:
World Development Indicators
Source organization:
International Labour Organization, Key Indicators of the Labour Market database.
Categories, topics:
Social Protection & Labor
Last updated:
apr 23, 2017
Indicators value changes by year
Minimum:
48.178
jan 1, 2015
Maximum:
62.843
jan 1, 1981
At the date of observation
Value
Absolute change
Change from previous value
jan 1, 1981
62.843
+62.843
0.0%
jan 1, 1982
62.502
-0.341
-0.54%
jan 1, 1983
61.525
-0.977
-1.56%
jan 1, 1984
60.571
-0.954
-1.55%
jan 1, 1985
60.947
+0.376
0.62%
jan 1, 1986
60.799
-0.148
-0.24%
jan 1, 1987
60.359
-0.439
-0.72%
jan 1, 1988
60.089
-0.271
-0.45%
jan 1, 1989
59.057
-1.032
-1.72%
jan 1, 1990
59.215
+0.158
0.27%
jan 1, 1991
58.705
-0.51
-0.86%
jan 1, 1992
58.011
-0.694
-1.18%
jan 1, 1993
56.742
-1.269
-2.19%
jan 1, 1994
56.242
-0.5
-0.88%
jan 1, 1995
55.883
-0.358
-0.64%
jan 1, 1996
55.199
-0.684
-1.22%
jan 1, 1997
54.648
-0.551
-1.0%
jan 1, 1998
54.227
-0.421
-0.77%
jan 1, 1999
54.364
+0.137
0.25%
jan 1, 2000
53.78
-0.584
-1.07%
jan 1, 2001
53.873
+0.093
0.17%
jan 1, 2002
53.366
-0.507
-0.94%
jan 1, 2003
52.896
-0.47
-0.88%
jan 1, 2004
52.832
-0.064
-0.12%
jan 1, 2005
52.636
-0.195
-0.37%
jan 1, 2006
52.623
-0.014
-0.03%
jan 1, 2007
51.906
-0.717
-1.36%
jan 1, 2008
51.368
-0.537
-1.04%
jan 1, 2009
51.156
-0.213
-0.41%
jan 1, 2010
49.644
-1.512
-2.96%
jan 1, 2011
49.535
-0.109
-0.22%
jan 1, 2012
49.412
-0.123
-0.25%
jan 1, 2013
49.1
-0.312
-0.63%
jan 1, 2014
48.382
-0.718
-1.46%
jan 1, 2015
48.178
-0.204
-0.42%
Ranking of countries by current statistics by years


Comments: