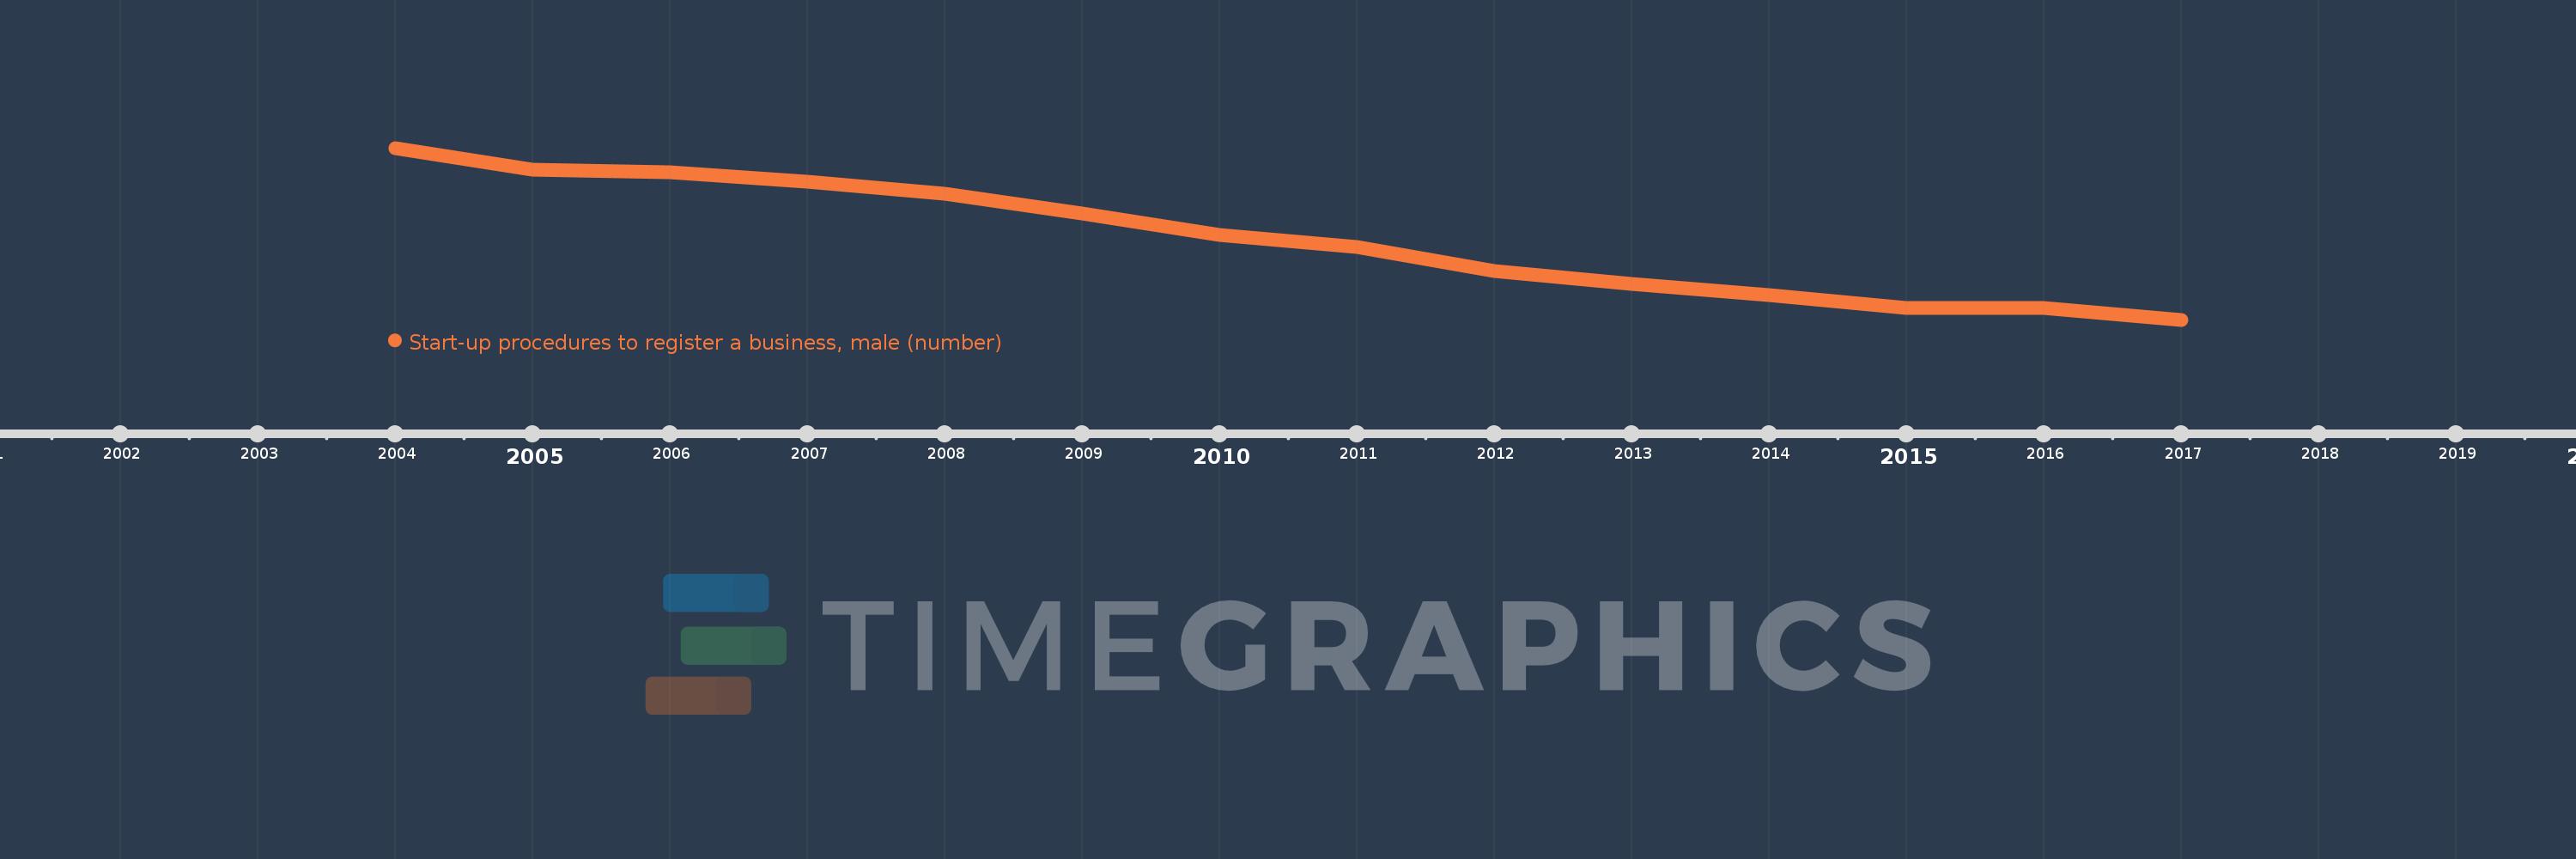
This timeline shows a graph from 2004 to 2017 of Heavily indebted poor countries (HIPC). No data until 2003. Number of actual observations by date: 14.
Source name:
World Development Indicators
Source organization:
World Bank, Doing Business project (http://www.doingbusiness.org/).
Categories, topics:
Private Sector
Last updated:
apr 23, 2017
Indicators value changes by year
Meaning:
9.403
Minimum:
7.41
jan 1, 2017
Maximum:
11.655
jan 1, 2004
At the date of observation
Value
Absolute change
Change from the previous value
jan 1, 2004
11.655
+11.655
0.0%
jan 1, 2005
11.118
-0.538
-4.61%
jan 1, 2006
11.054
-0.064
-0.57%
jan 1, 2007
10.816
-0.238
-2.16%
jan 1, 2008
10.526
-0.289
-2.68%
jan 1, 2009
10.026
-0.5
-4.75%
jan 1, 2010
9.5
-0.526
-5.25%
jan 1, 2011
9.211
-0.289
-3.05%
jan 1, 2012
8.605
-0.605
-6.57%
jan 1, 2013
8.289
-0.316
-3.67%
jan 1, 2014
8.026
-0.263
-3.17%
jan 1, 2015
7.711
-0.316
-3.93%
jan 1, 2016
7.692
-0.018
-0.24%
jan 1, 2017
7.41
-0.282
-3.67%
Ranking of countries by current statistics by years
