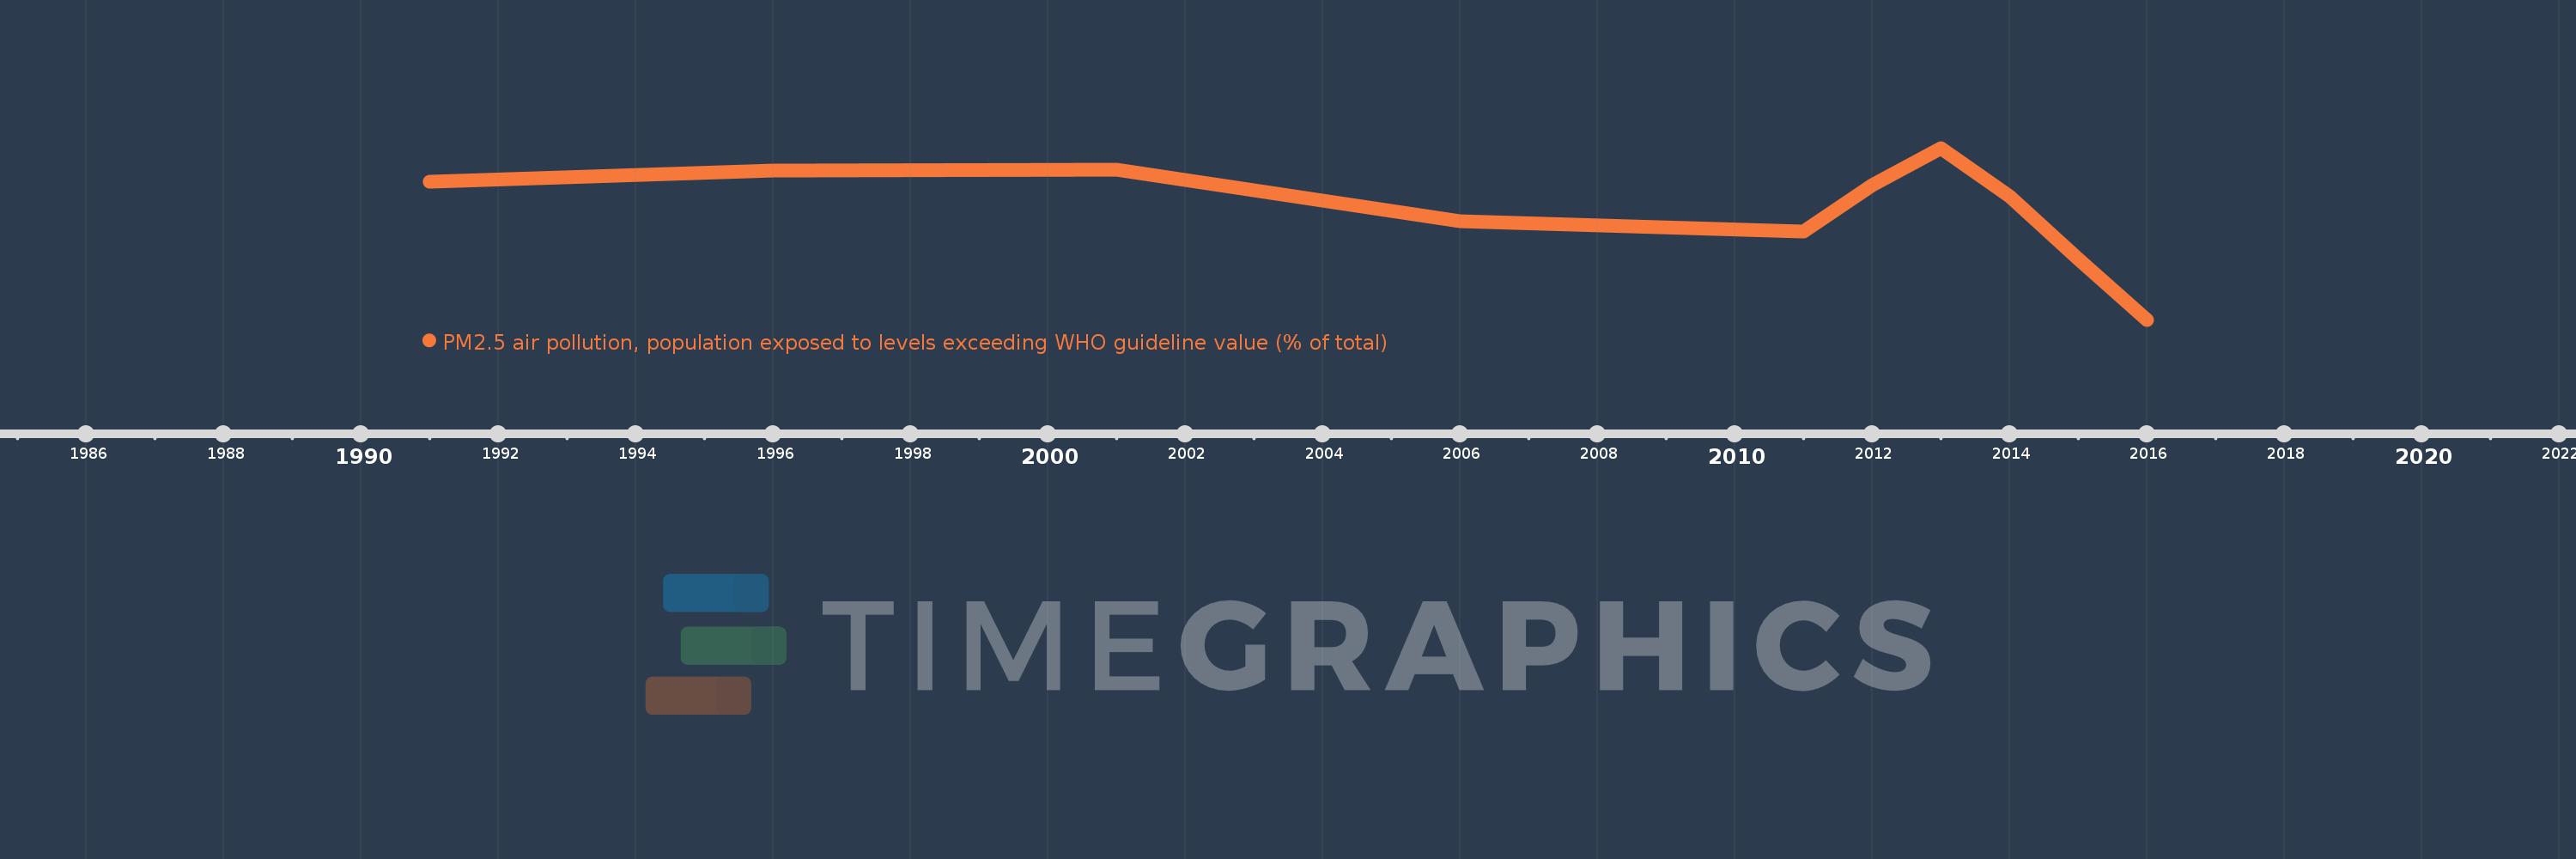
This timeline shows a graph from 1991 to 2016 of Heavily indebted poor countries (HIPC). No data until 1990. Number of actual observations by date: 10.
Source name:
World Development Indicators
Source organization:
Brauer, M. et al. 2016, for the Global Burden of Disease Study 2015.
Categories, topics:
Urban Development, Environment
Last updated:
apr 23, 2017
Indicators value changes by year
Meaning:
99.57
Minimum:
99.317
jan 1, 2016
Maximum:
99.707
jan 1, 2013
At the date of observation
Value
Absolute change
Change from the previous value
jan 1, 1991
99.631
+99.631
0.0%
jan 1, 1996
99.655
+0.024
0.02%
jan 1, 2001
99.658
+0.003
0.0%
jan 1, 2006
99.54
-0.118
-0.12%
jan 1, 2011
99.517
-0.023
-0.02%
jan 1, 2012
99.623
+0.105
0.11%
jan 1, 2013
99.707
+0.084
0.08%
jan 1, 2014
99.597
-0.11
-0.11%
jan 1, 2015
99.455
-0.142
-0.14%
jan 1, 2016
99.317
-0.138
-0.14%
Ranking of countries by current statistics by years
