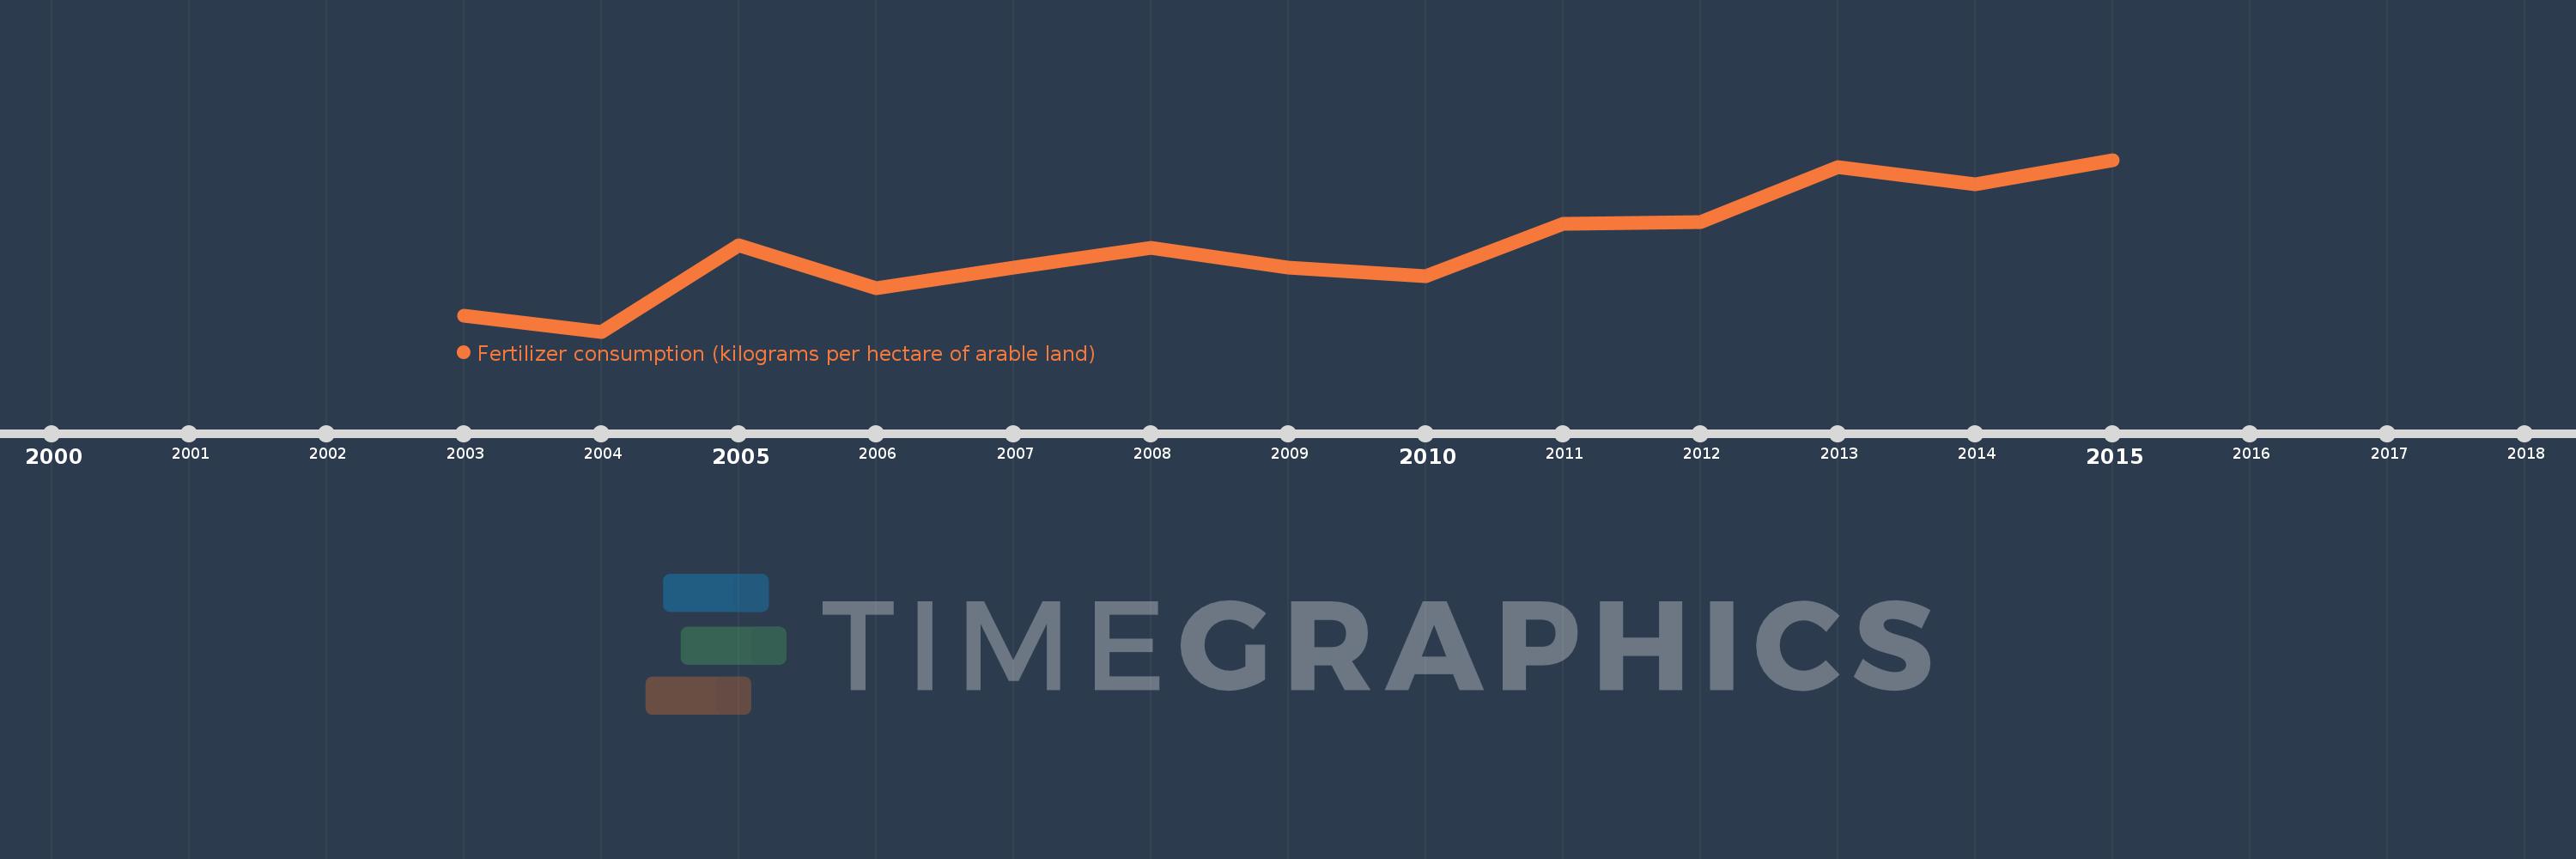
This timeline shows a graph from 2003 to 2015 of Heavily indebted poor countries (HIPC). No data until 2002. Number of actual observations by date: 13.
Source name:
World Development Indicators
Source organization:
Food and Agriculture Organization, electronic files and web site.
Categories, topics:
Agriculture & Rural Development
Last updated:
apr 23, 2017
Indicators value changes by year
Meaning:
10.095
Minimum:
6.164
jan 1, 2004
Maximum:
14.045
jan 1, 2015
At the date of observation
Value
Absolute change
Change from the previous value
jan 1, 2003
6.909
+6.909
0.0%
jan 1, 2004
6.164
-0.745
-10.78%
jan 1, 2005
10.112
+3.948
64.04%
jan 1, 2006
8.162
-1.95
-19.28%
jan 1, 2007
9.1
+0.938
11.49%
jan 1, 2008
10.004
+0.904
9.94%
jan 1, 2009
9.083
-0.921
-9.21%
jan 1, 2010
8.69
-0.392
-4.32%
jan 1, 2011
11.107
+2.417
27.82%
jan 1, 2012
11.202
+0.094
0.85%
jan 1, 2013
13.716
+2.514
22.45%
jan 1, 2014
12.941
-0.775
-5.65%
jan 1, 2015
14.045
+1.104
8.53%
Ranking of countries by current statistics by years
