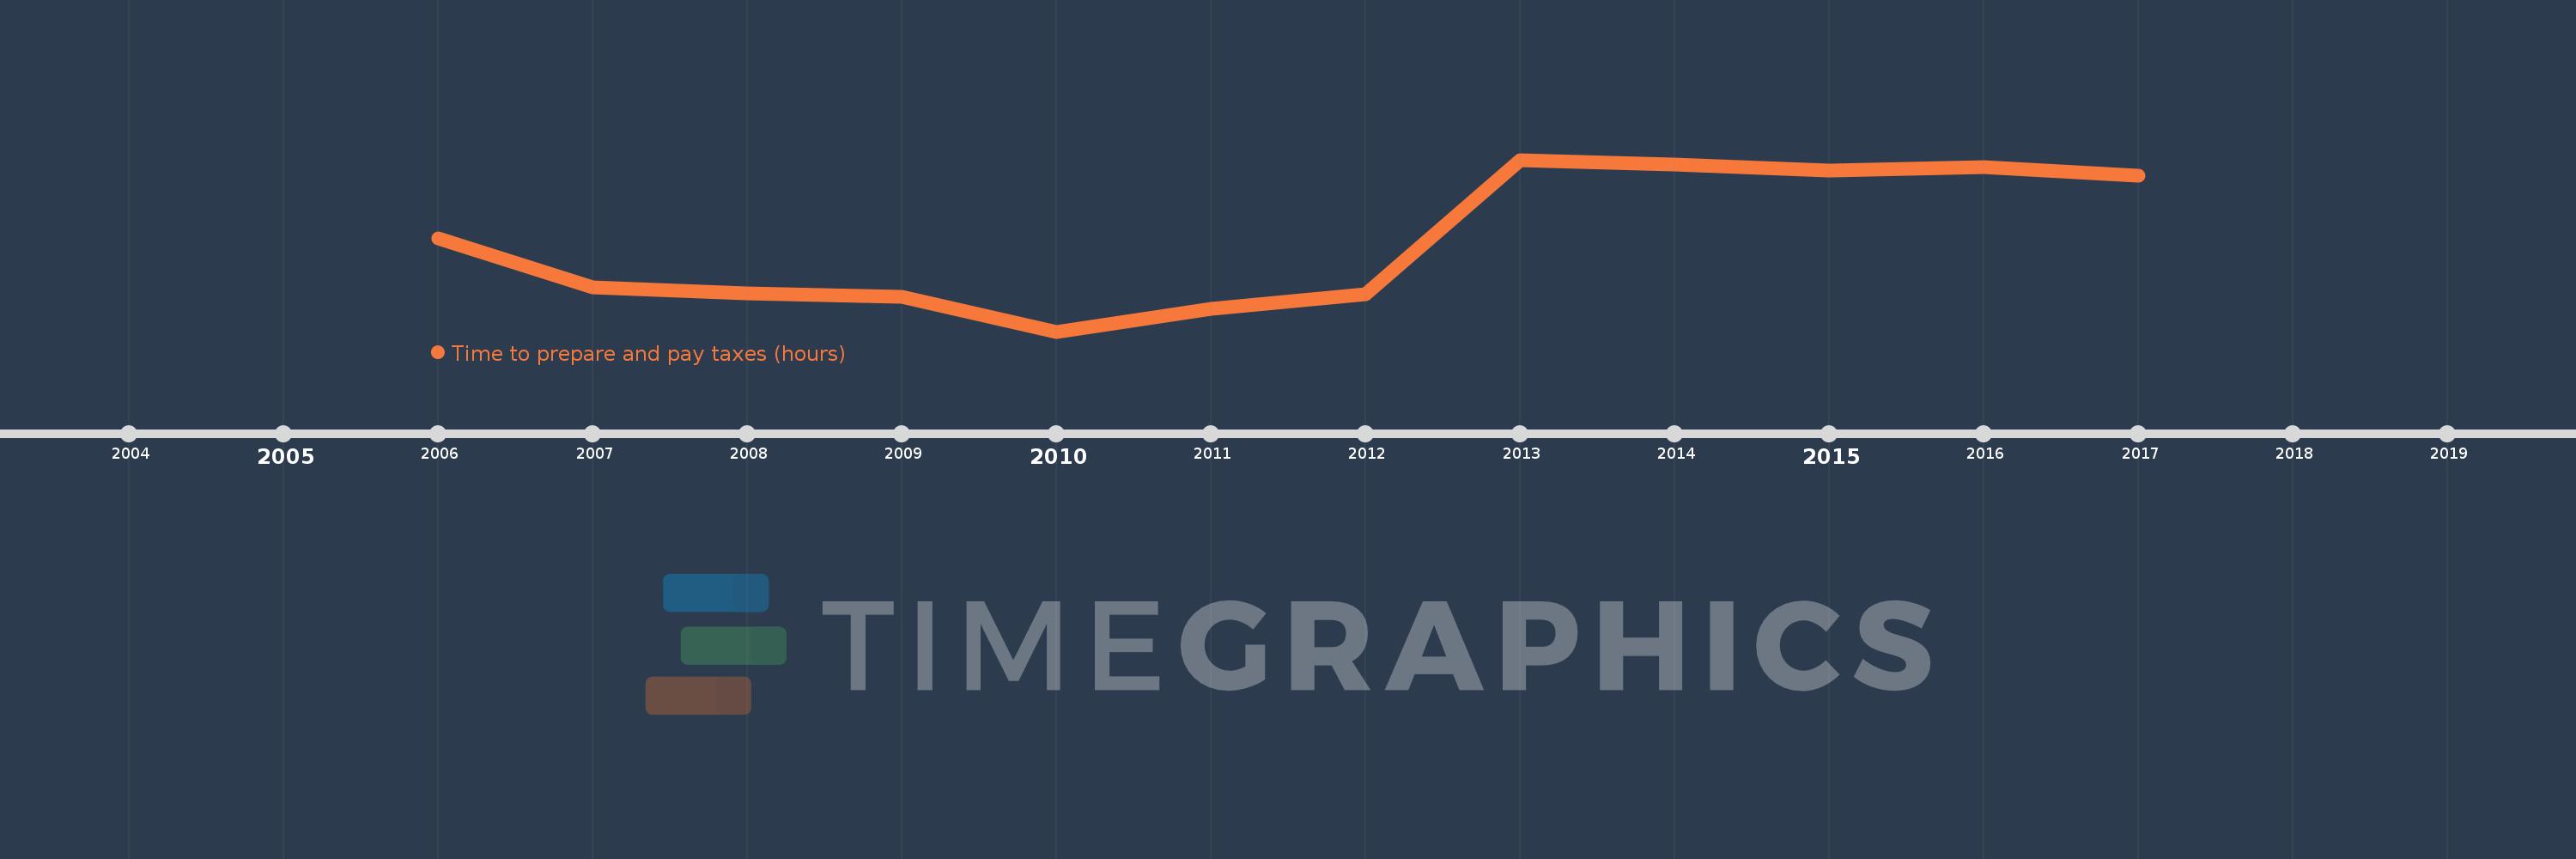
This timeline shows a graph from 2006 to 2017 of Fragile and conflict affected situations. No data until 2005. Number of actual observations by date: 12.
Source name:
World Development Indicators
Source organization:
World Bank, Doing Business project (http://www.doingbusiness.org/).
Categories, topics:
Private Sector, Public Sector
Last updated:
apr 23, 2017
Indicators value changes by year
Meaning:
249.855
Minimum:
237.317
jan 1, 2010
Maximum:
261.0
jan 1, 2013
At the date of observation
Value
Absolute change
Change from the previous value
jan 1, 2006
250.196
+250.196
0.0%
jan 1, 2007
243.431
-6.765
-2.7%
jan 1, 2008
242.534
-0.897
-0.37%
jan 1, 2009
242.121
-0.414
-0.17%
jan 1, 2010
237.317
-4.804
-1.98%
jan 1, 2011
240.5
+3.183
1.34%
jan 1, 2012
242.45
+1.95
0.81%
jan 1, 2013
261.0
+18.55
7.65%
jan 1, 2014
260.394
-0.606
-0.23%
jan 1, 2015
259.561
-0.833
-0.32%
jan 1, 2016
259.985
+0.424
0.16%
jan 1, 2017
258.773
-1.212
-0.47%
Ranking of countries by current statistics by years
