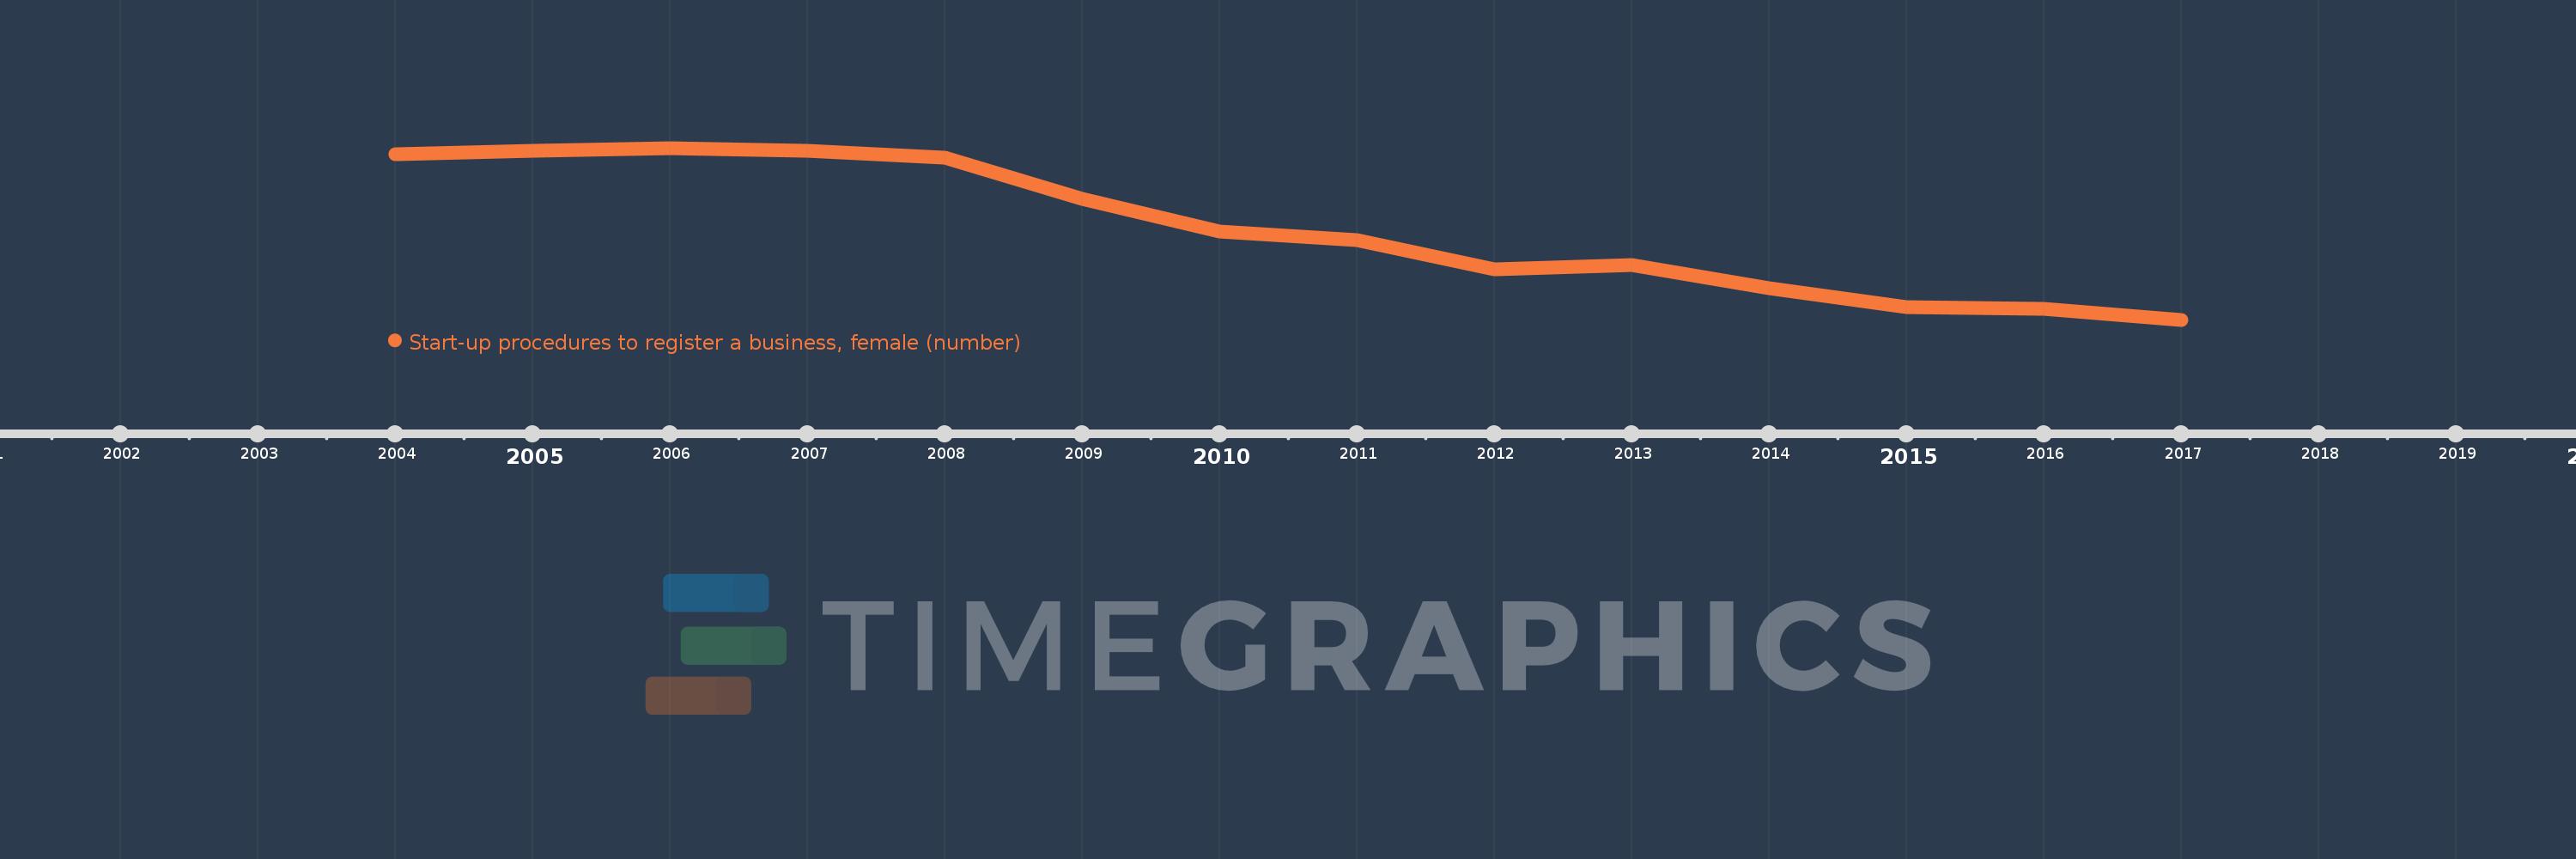
This timeline shows a graph from 2004 to 2017 of Fragile and conflict affected situations. No data until 2003. Number of actual observations by date: 14.
Source name:
World Development Indicators
Source organization:
World Bank, Doing Business project (http://www.doingbusiness.org/).
Categories, topics:
Private Sector
Last updated:
apr 23, 2017
Indicators value changes by year
Meaning:
9.195
Minimum:
7.735
jan 1, 2017
Maximum:
10.464
jan 1, 2006
At the date of observation
Value
Absolute change
Change from the previous value
jan 1, 2004
10.368
+10.368
0.0%
jan 1, 2005
10.417
+0.048
0.47%
jan 1, 2006
10.464
+0.048
0.46%
jan 1, 2007
10.414
-0.05
-0.48%
jan 1, 2008
10.31
-0.103
-0.99%
jan 1, 2009
9.655
-0.655
-6.35%
jan 1, 2010
9.133
-0.522
-5.4%
jan 1, 2011
9.0
-0.133
-1.46%
jan 1, 2012
8.533
-0.467
-5.19%
jan 1, 2013
8.606
+0.073
0.85%
jan 1, 2014
8.242
-0.364
-4.23%
jan 1, 2015
7.939
-0.303
-3.68%
jan 1, 2016
7.912
-0.028
-0.35%
jan 1, 2017
7.735
-0.176
-2.23%
Ranking of countries by current statistics by years
