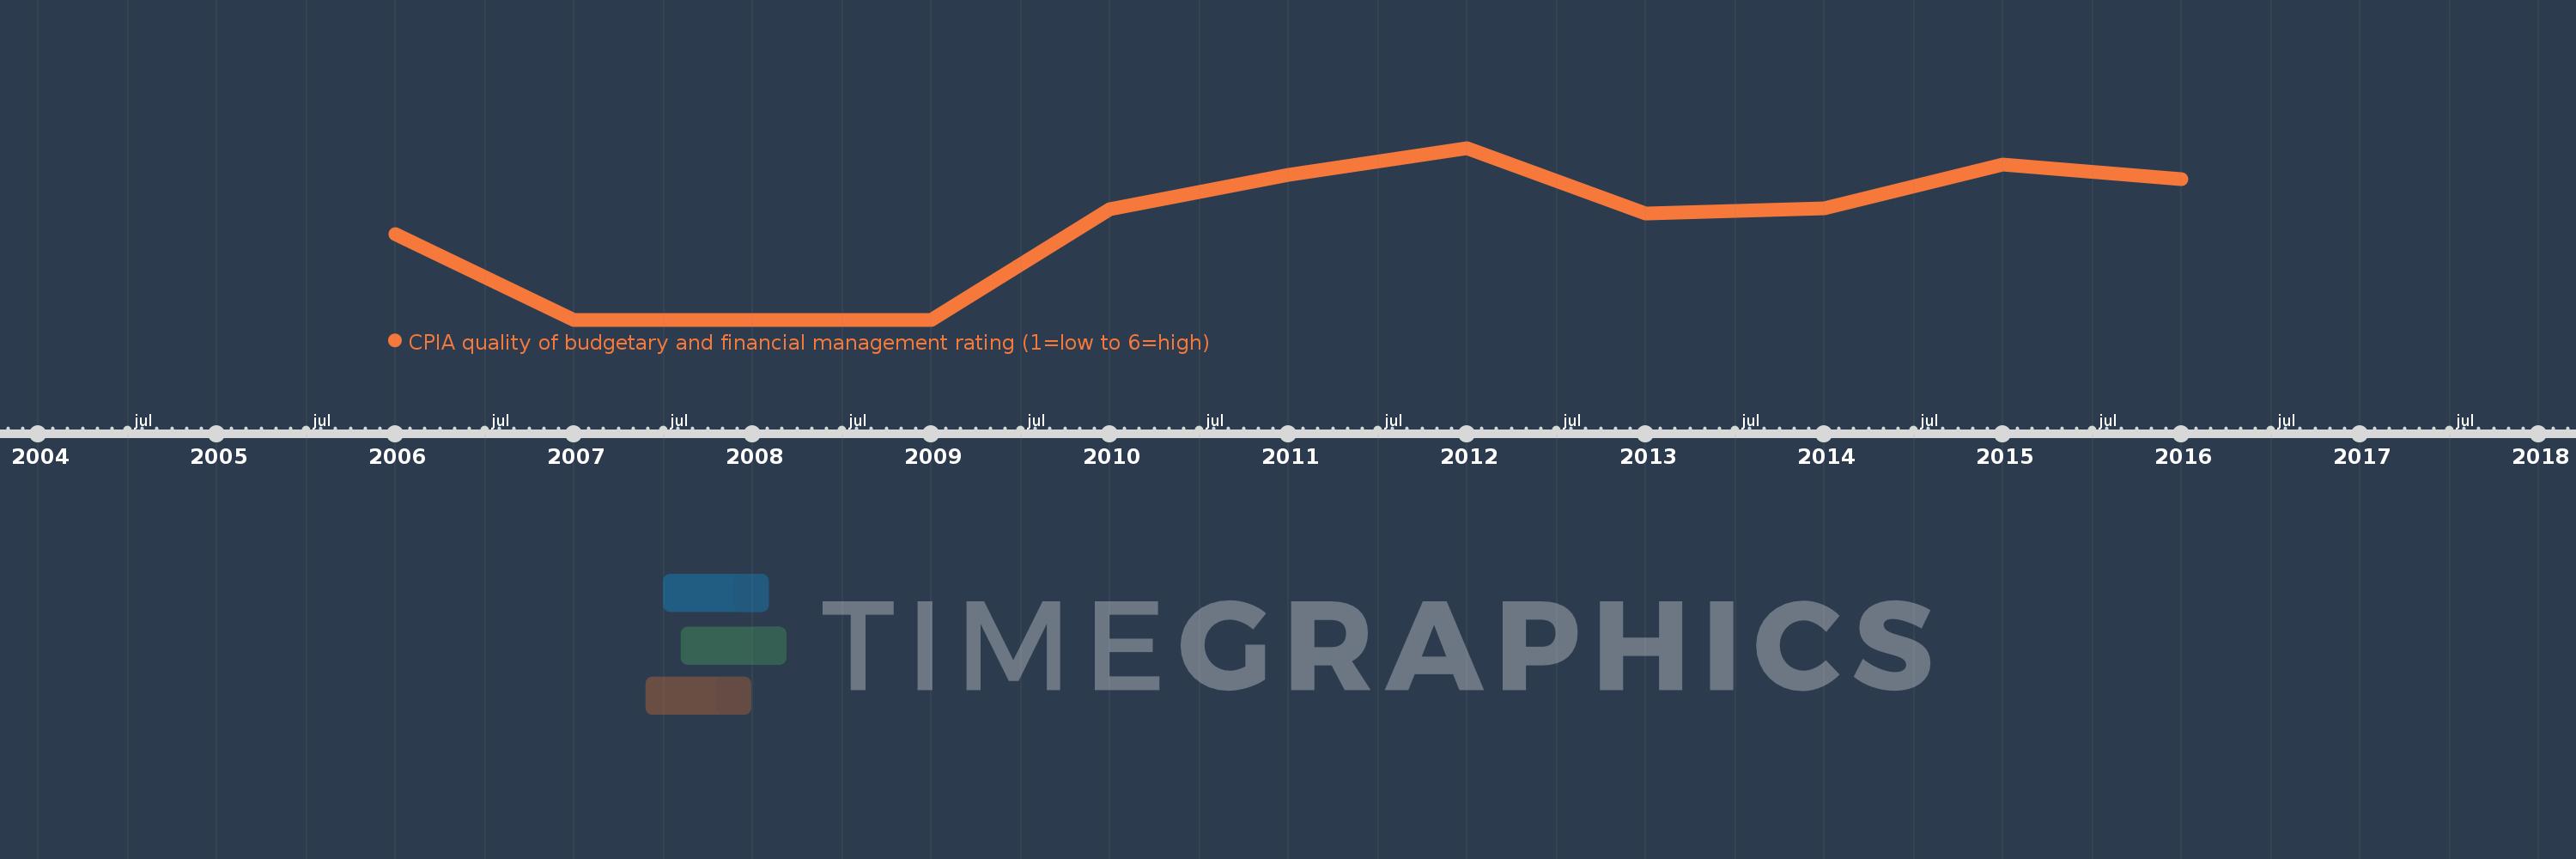
This timeline shows a graph from 2006 to 2016 of Fragile and conflict affected situations. No data until 2005. Number of actual observations by date: 11.
Source name:
World Development Indicators
Source organization:
World Bank Group, CPIA database (http://www.worldbank.org/ida).
Categories, topics:
Public Sector
Last updated:
apr 23, 2017
Indicators value changes by year
Meaning:
2.771
Minimum:
2.659
jan 1, 2007
Maximum:
2.865
jan 1, 2012
At the date of observation
Value
Absolute change
Change from the previous value
jan 1, 2006
2.762
+2.762
0.0%
jan 1, 2007
2.659
-0.103
-3.72%
jan 1, 2008
2.659
0.0
0.0%
jan 1, 2009
2.659
0.0
0.0%
jan 1, 2010
2.792
+0.133
4.99%
jan 1, 2011
2.833
+0.042
1.49%
jan 1, 2012
2.865
+0.032
1.13%
jan 1, 2013
2.786
-0.08
-2.78%
jan 1, 2014
2.793
+0.007
0.27%
jan 1, 2015
2.845
+0.052
1.85%
jan 1, 2016
2.828
-0.017
-0.61%
Ranking of countries by current statistics by years
