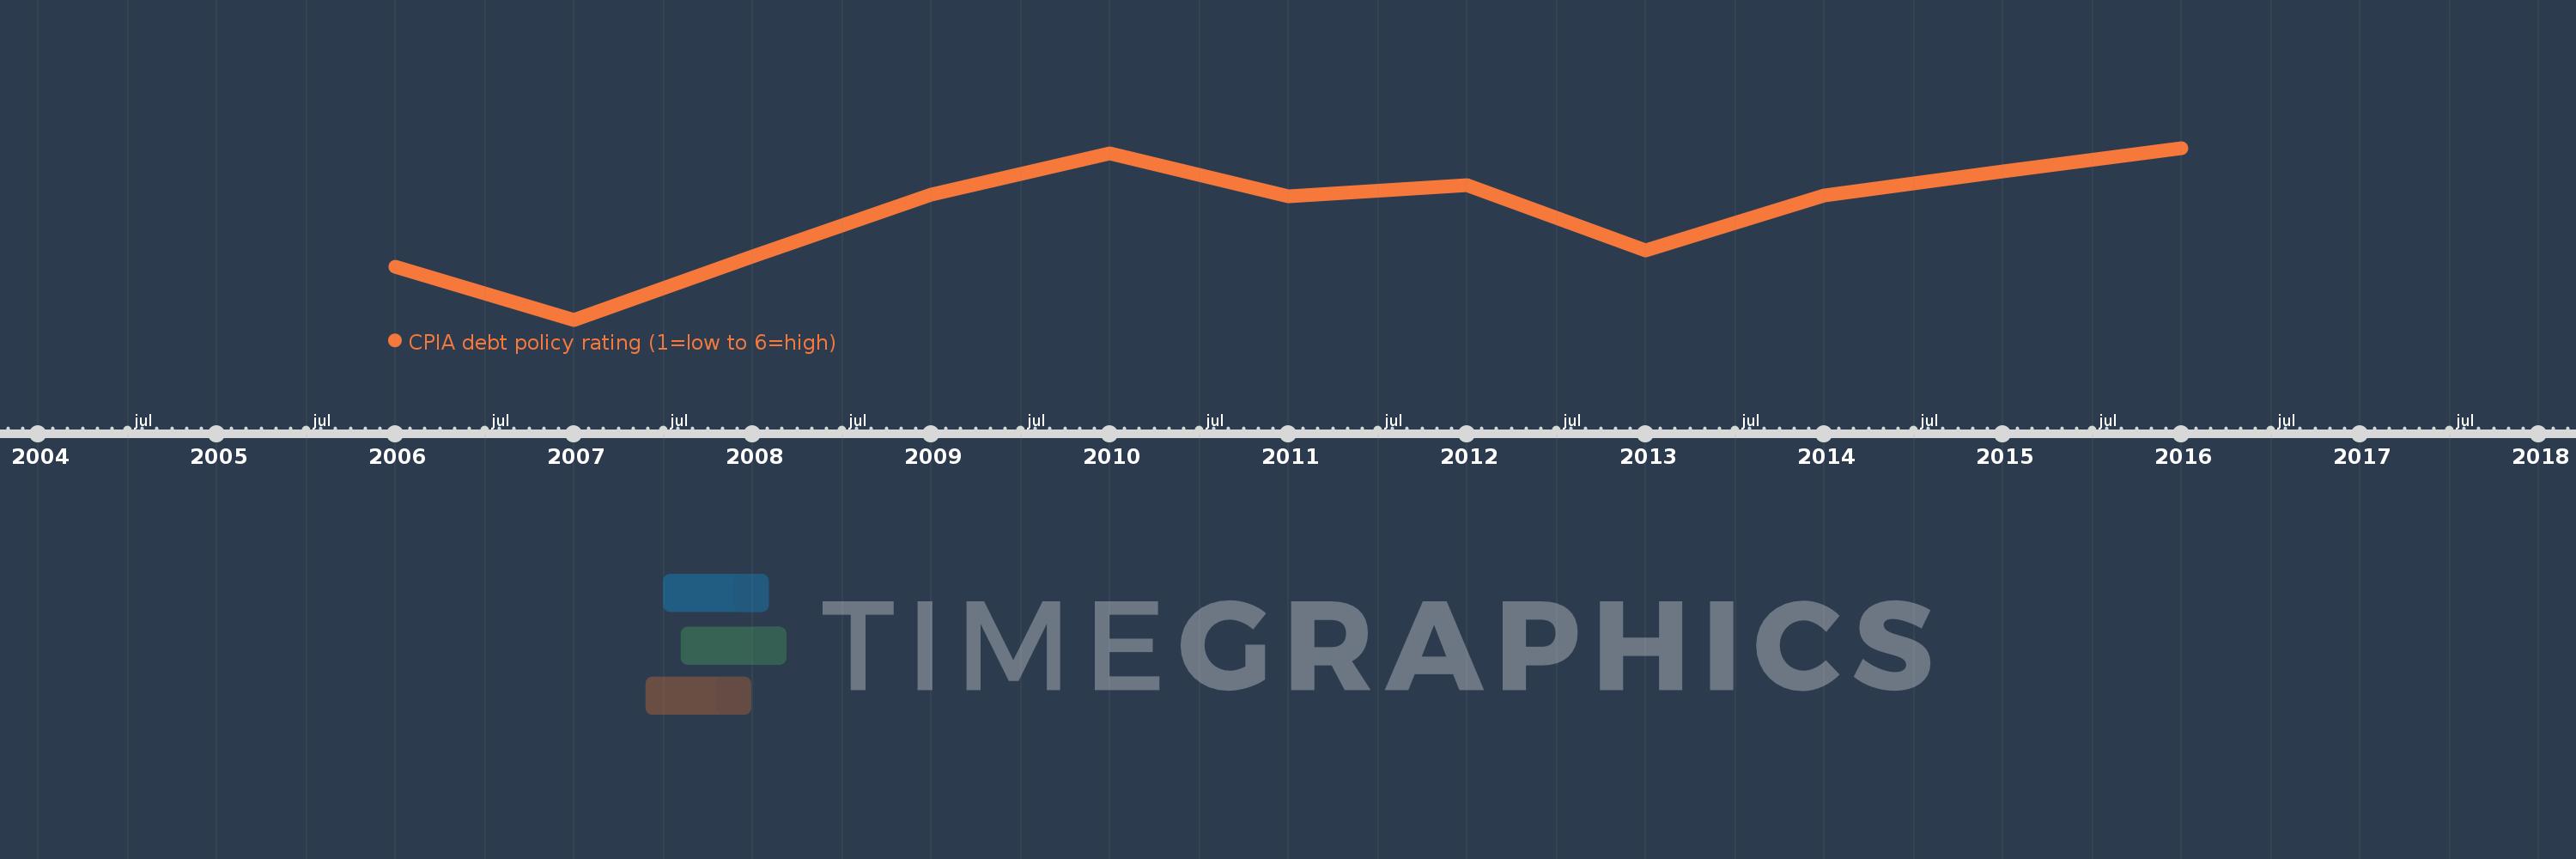
This timeline shows a graph from 2006 to 2016 of Fragile and conflict affected situations. No data until 2005. Number of actual observations by date: 11.
Source name:
World Development Indicators
Source organization:
World Bank Group, CPIA database (http://www.worldbank.org/ida).
Categories, topics:
Public Sector
Last updated:
apr 23, 2017
Indicators value changes by year
Meaning:
2.769
Minimum:
2.614
jan 1, 2007
Maximum:
2.862
jan 1, 2016
At the date of observation
Value
Absolute change
Change from the previous value
jan 1, 2006
2.69
+2.69
0.0%
jan 1, 2007
2.614
-0.077
-2.86%
jan 1, 2008
2.705
+0.091
3.48%
jan 1, 2009
2.795
+0.091
3.36%
jan 1, 2010
2.854
+0.059
2.1%
jan 1, 2011
2.792
-0.063
-2.19%
jan 1, 2012
2.808
+0.016
0.57%
jan 1, 2013
2.714
-0.093
-3.33%
jan 1, 2014
2.793
+0.079
2.9%
jan 1, 2015
2.828
+0.034
1.23%
jan 1, 2016
2.862
+0.034
1.22%
Ranking of countries by current statistics by years
