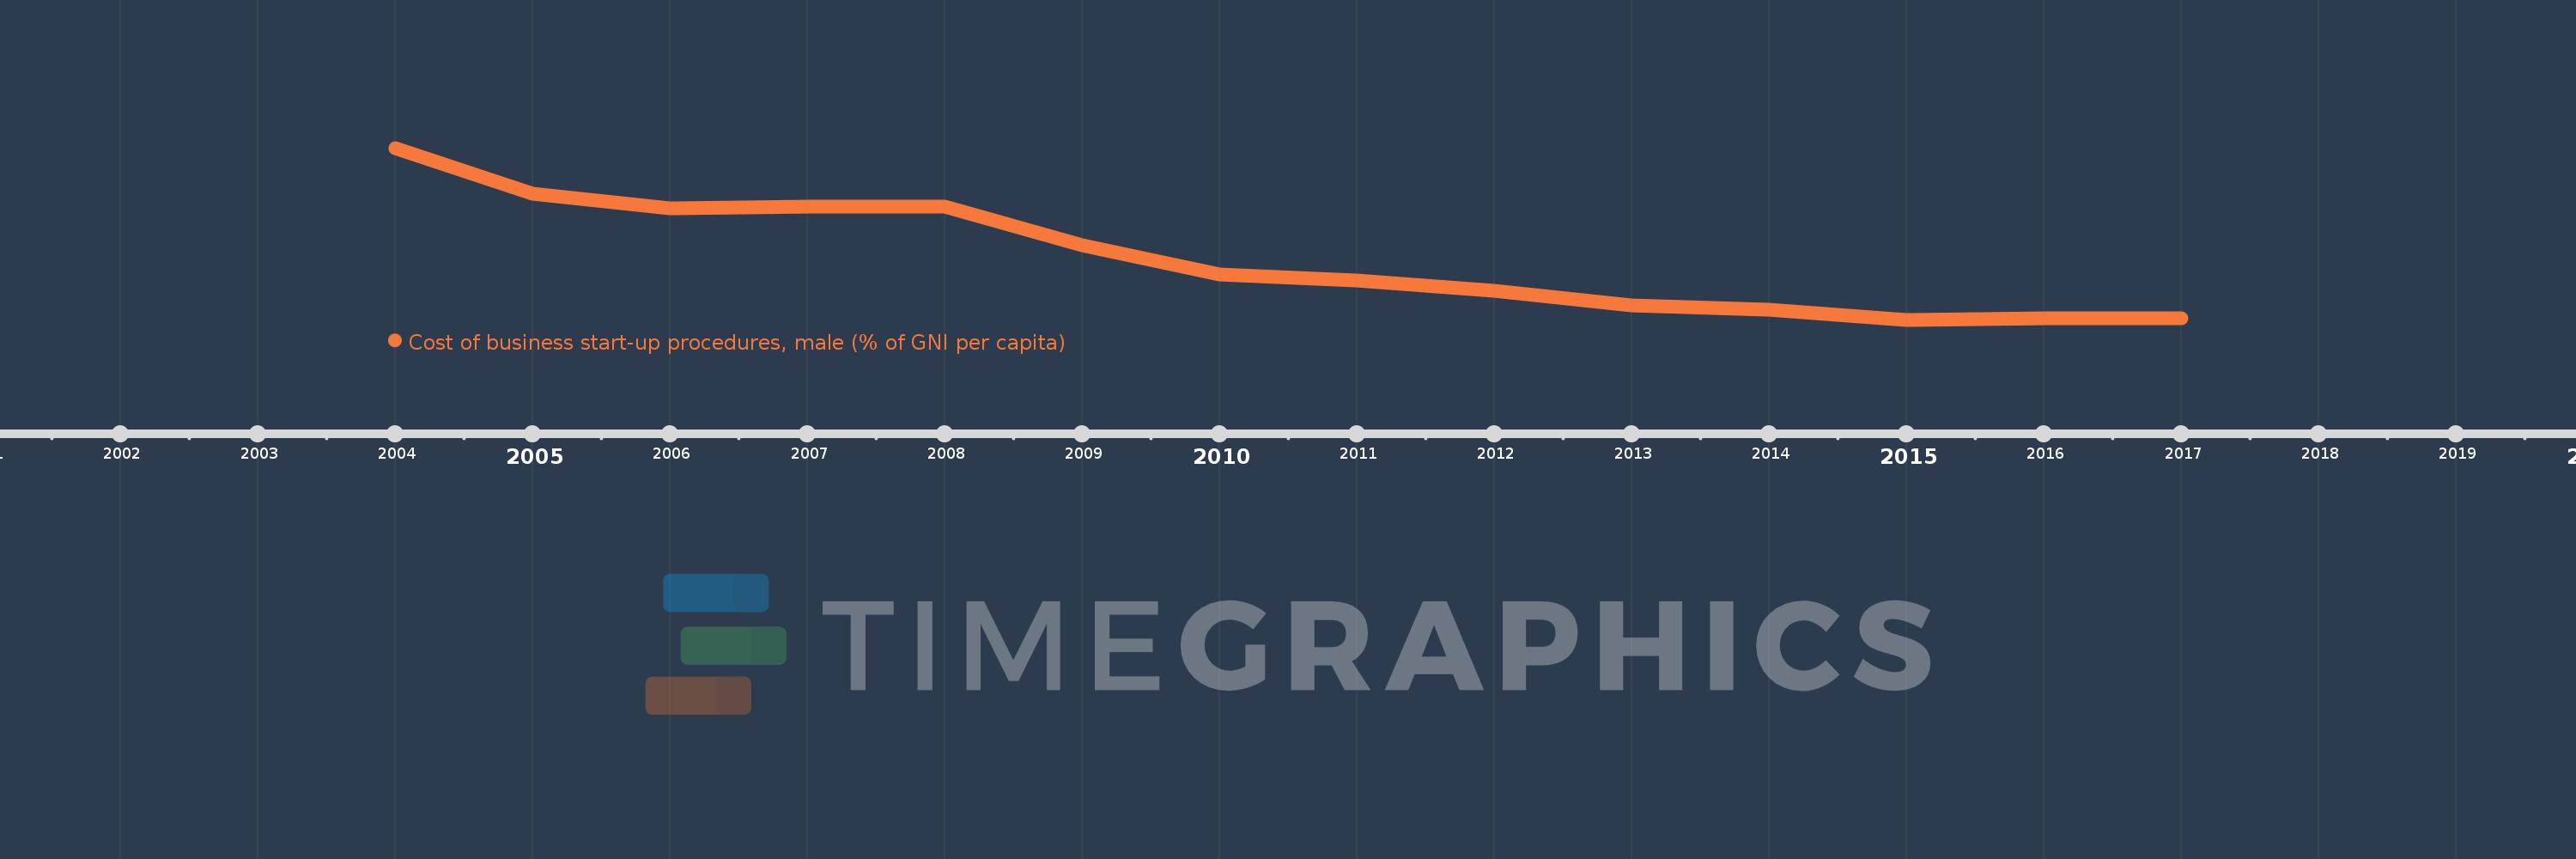
This timeline shows a graph from 2004 to 2017 of Fragile and conflict affected situations. No data until 2003. Number of actual observations by date: 14.
Source name:
World Development Indicators
Source organization:
World Bank, Doing Business project (http://www.doingbusiness.org/).
Categories, topics:
Private Sector
Last updated:
apr 23, 2017
Indicators value changes by year
Meaning:
165.284
Minimum:
75.47
jan 1, 2015
Maximum:
329.511
jan 1, 2004
At the date of observation
Value
Absolute change
Change from the previous value
jan 1, 2004
329.511
+329.511
0.0%
jan 1, 2005
262.308
-67.202
-20.39%
jan 1, 2006
240.196
-22.112
-8.43%
jan 1, 2007
242.272
+2.076
0.86%
jan 1, 2008
242.338
+0.066
0.03%
jan 1, 2009
185.003
-57.334
-23.66%
jan 1, 2010
142.297
-42.707
-23.08%
jan 1, 2011
133.6
-8.697
-6.11%
jan 1, 2012
118.383
-15.217
-11.39%
jan 1, 2013
97.067
-21.317
-18.01%
jan 1, 2014
89.909
-7.158
-7.37%
jan 1, 2015
75.47
-14.439
-16.06%
jan 1, 2016
78.106
+2.636
3.49%
jan 1, 2017
77.512
-0.594
-0.76%
Ranking of countries by current statistics by years
