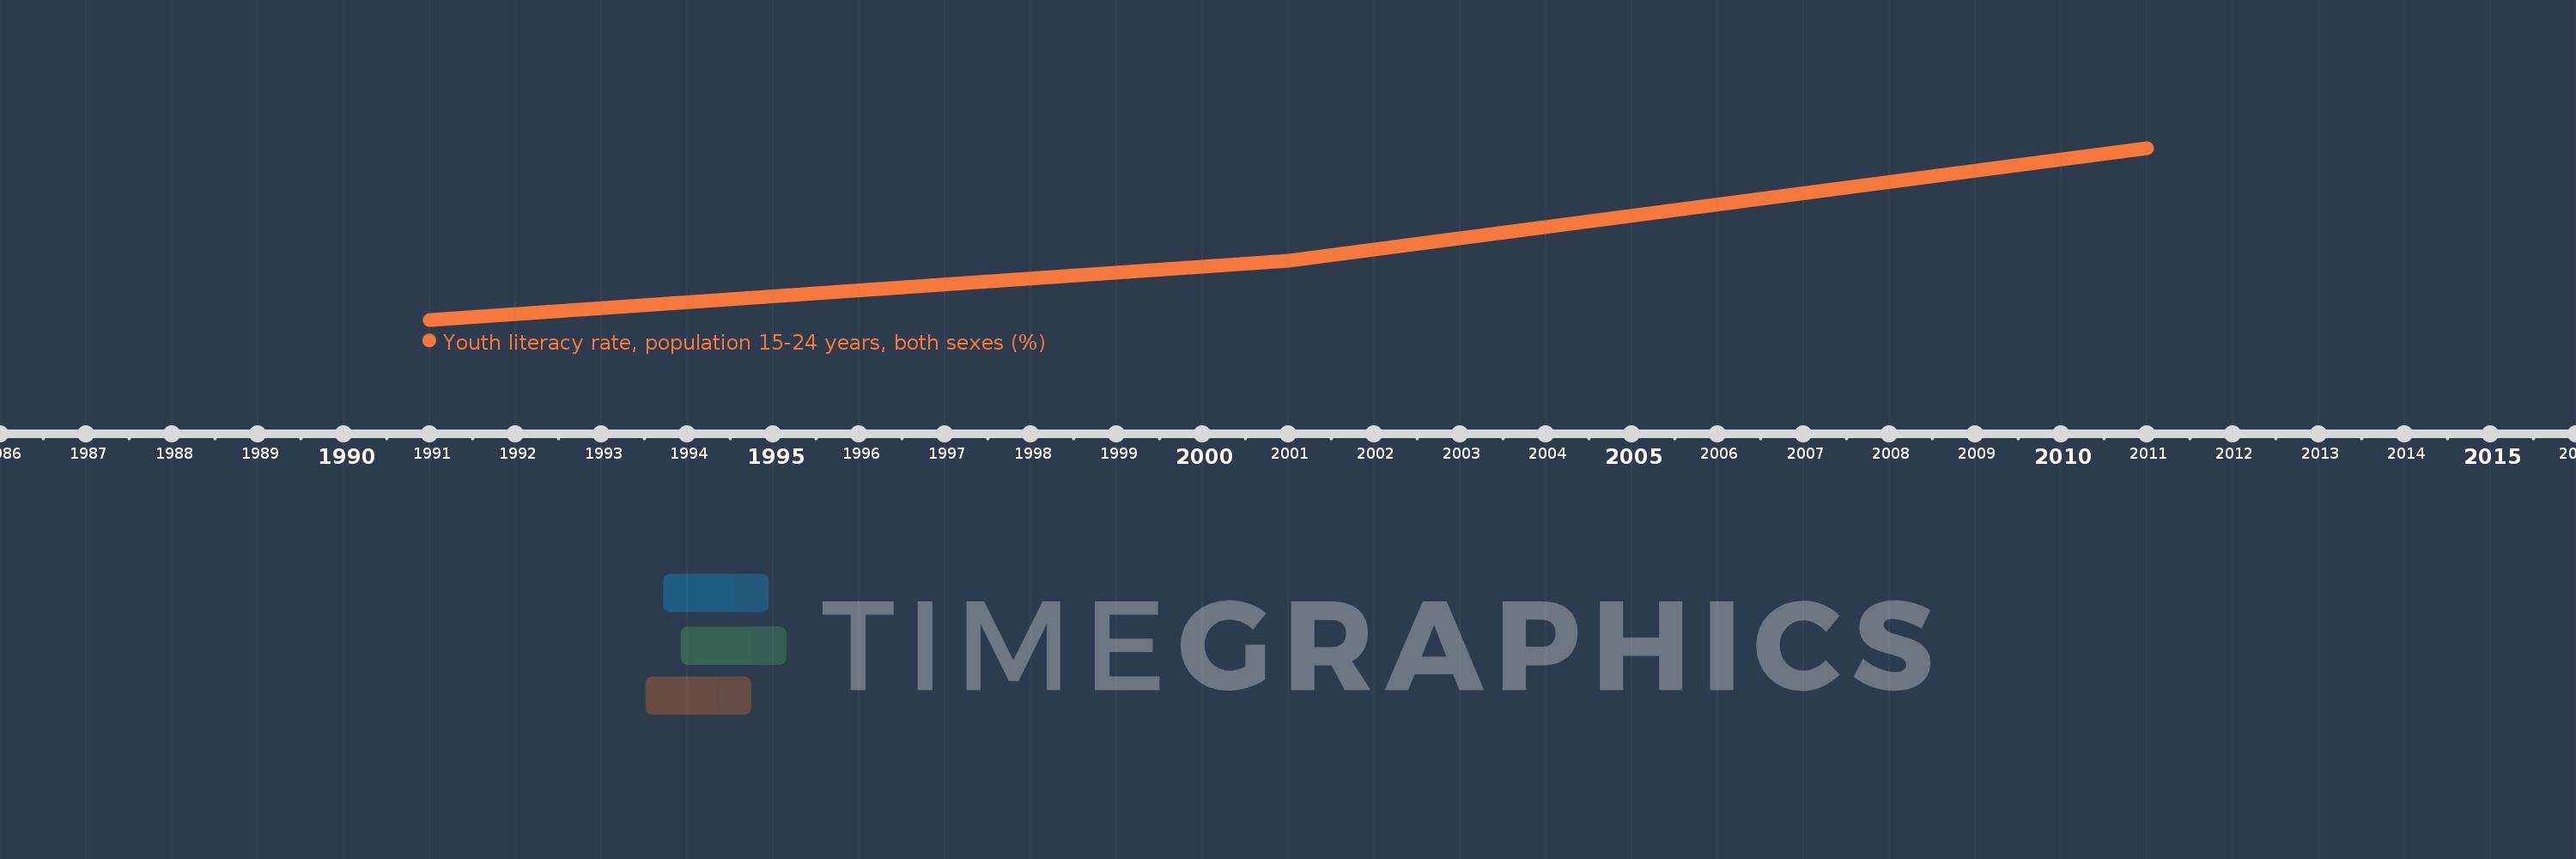
This timeline shows a graph from 1991 to 2011 of Europe & Central Asia (IDA & IBRD countries). No data until 1990. Number of actual observations by date: 3.
Source name:
World Development Indicators
Source organization:
UNESCO Institute for Statistics
Categories, topics:
Education
Last updated:
apr 23, 2017
Indicators value changes by year
Meaning:
99.053
Minimum:
98.568
jan 1, 1991
Maximum:
99.652
jan 1, 2011
At the date of observation
Value
Absolute change
Change from the previous value
jan 1, 1991
98.568
+98.568
0.0%
jan 1, 2001
98.939
+0.371
0.38%
jan 1, 2011
99.652
+0.714
0.72%
Ranking of countries by current statistics by years
