30
/
AIzaSyAYiBZKx7MnpbEhh9jyipgxe19OcubqV5w
April 1, 2024
32744
Europe & Central Asia (IDA & IBRD countries)
TEC
false
2
1
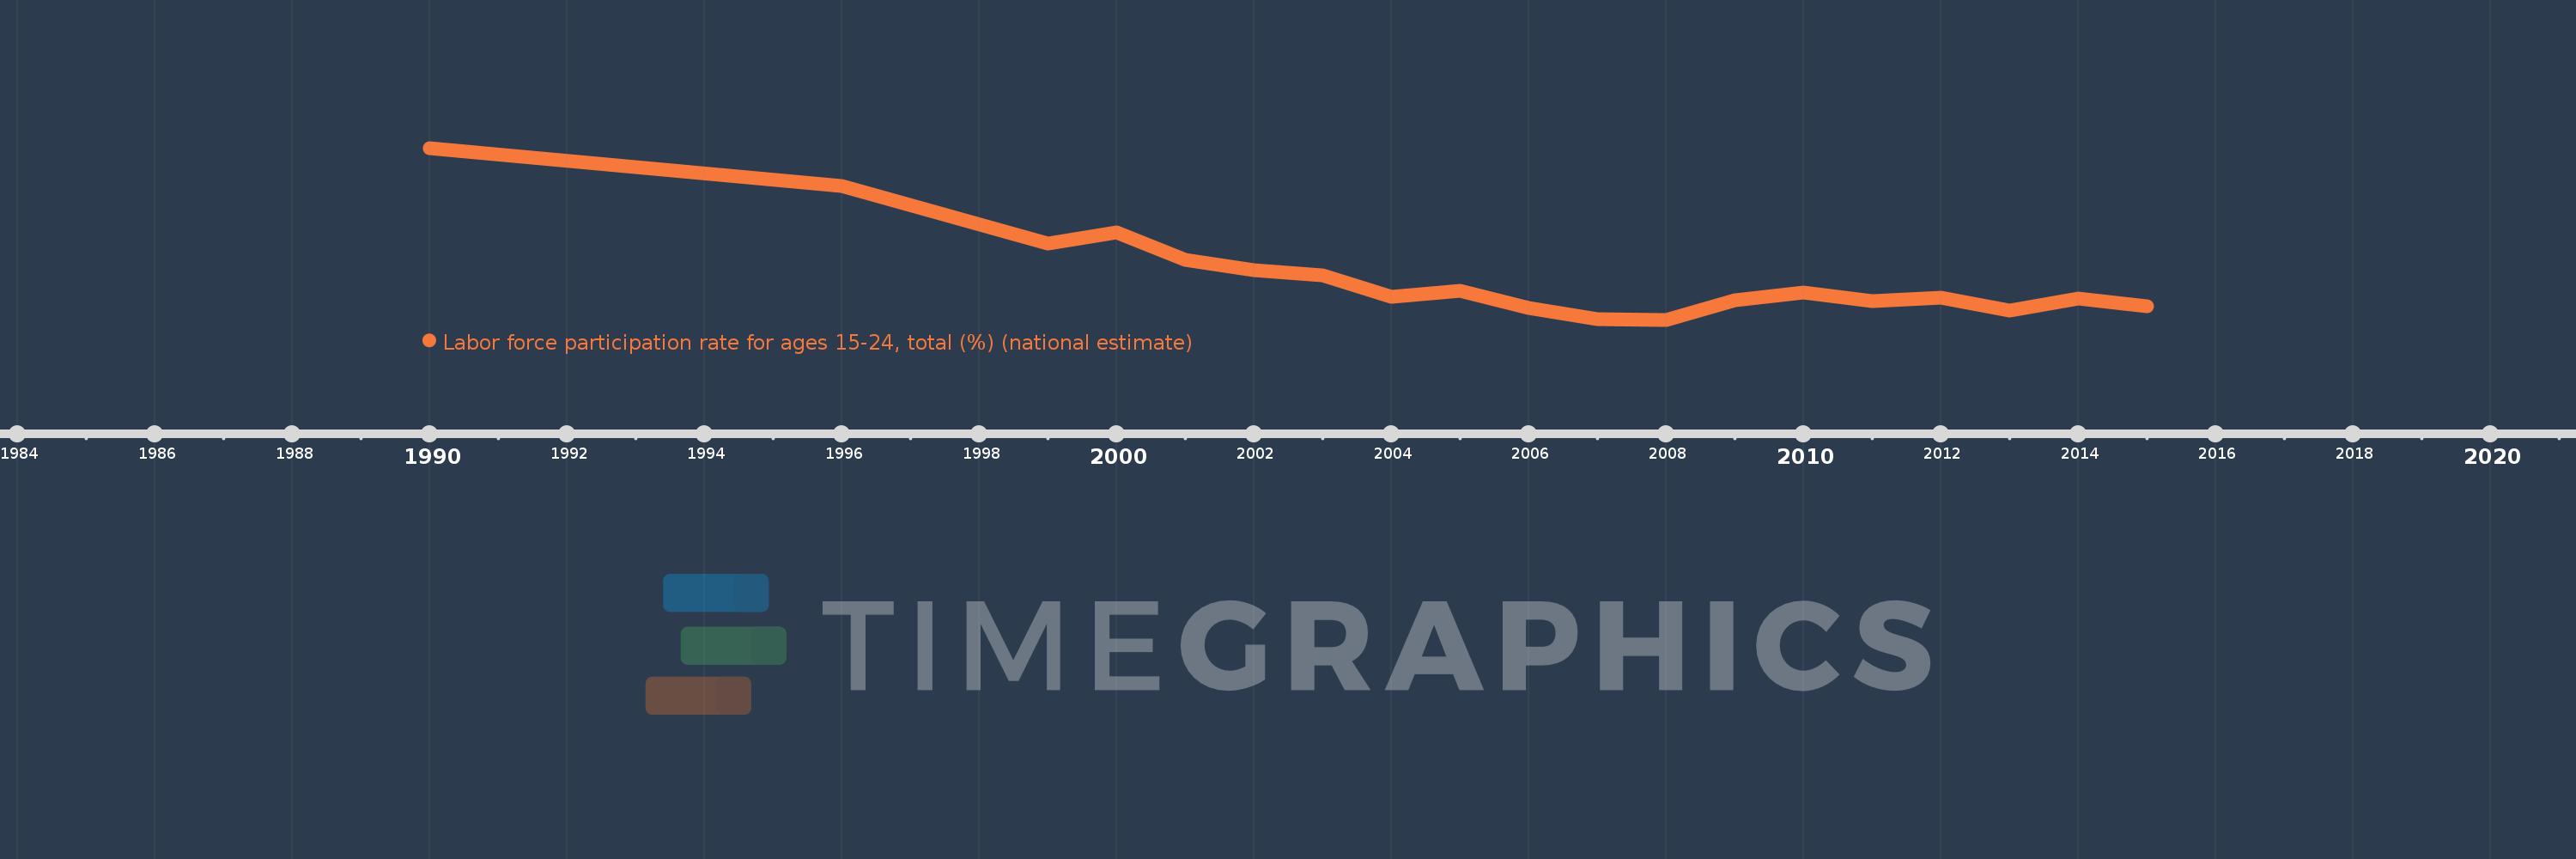
Labor force participation rate for ages 15-24, total (%) (national estimate)
2015,2014,2013,2012,2011,2010,2009,2008,2007,2006,2005,2004,2003,2002,2001,2000,1999,1996,1990
