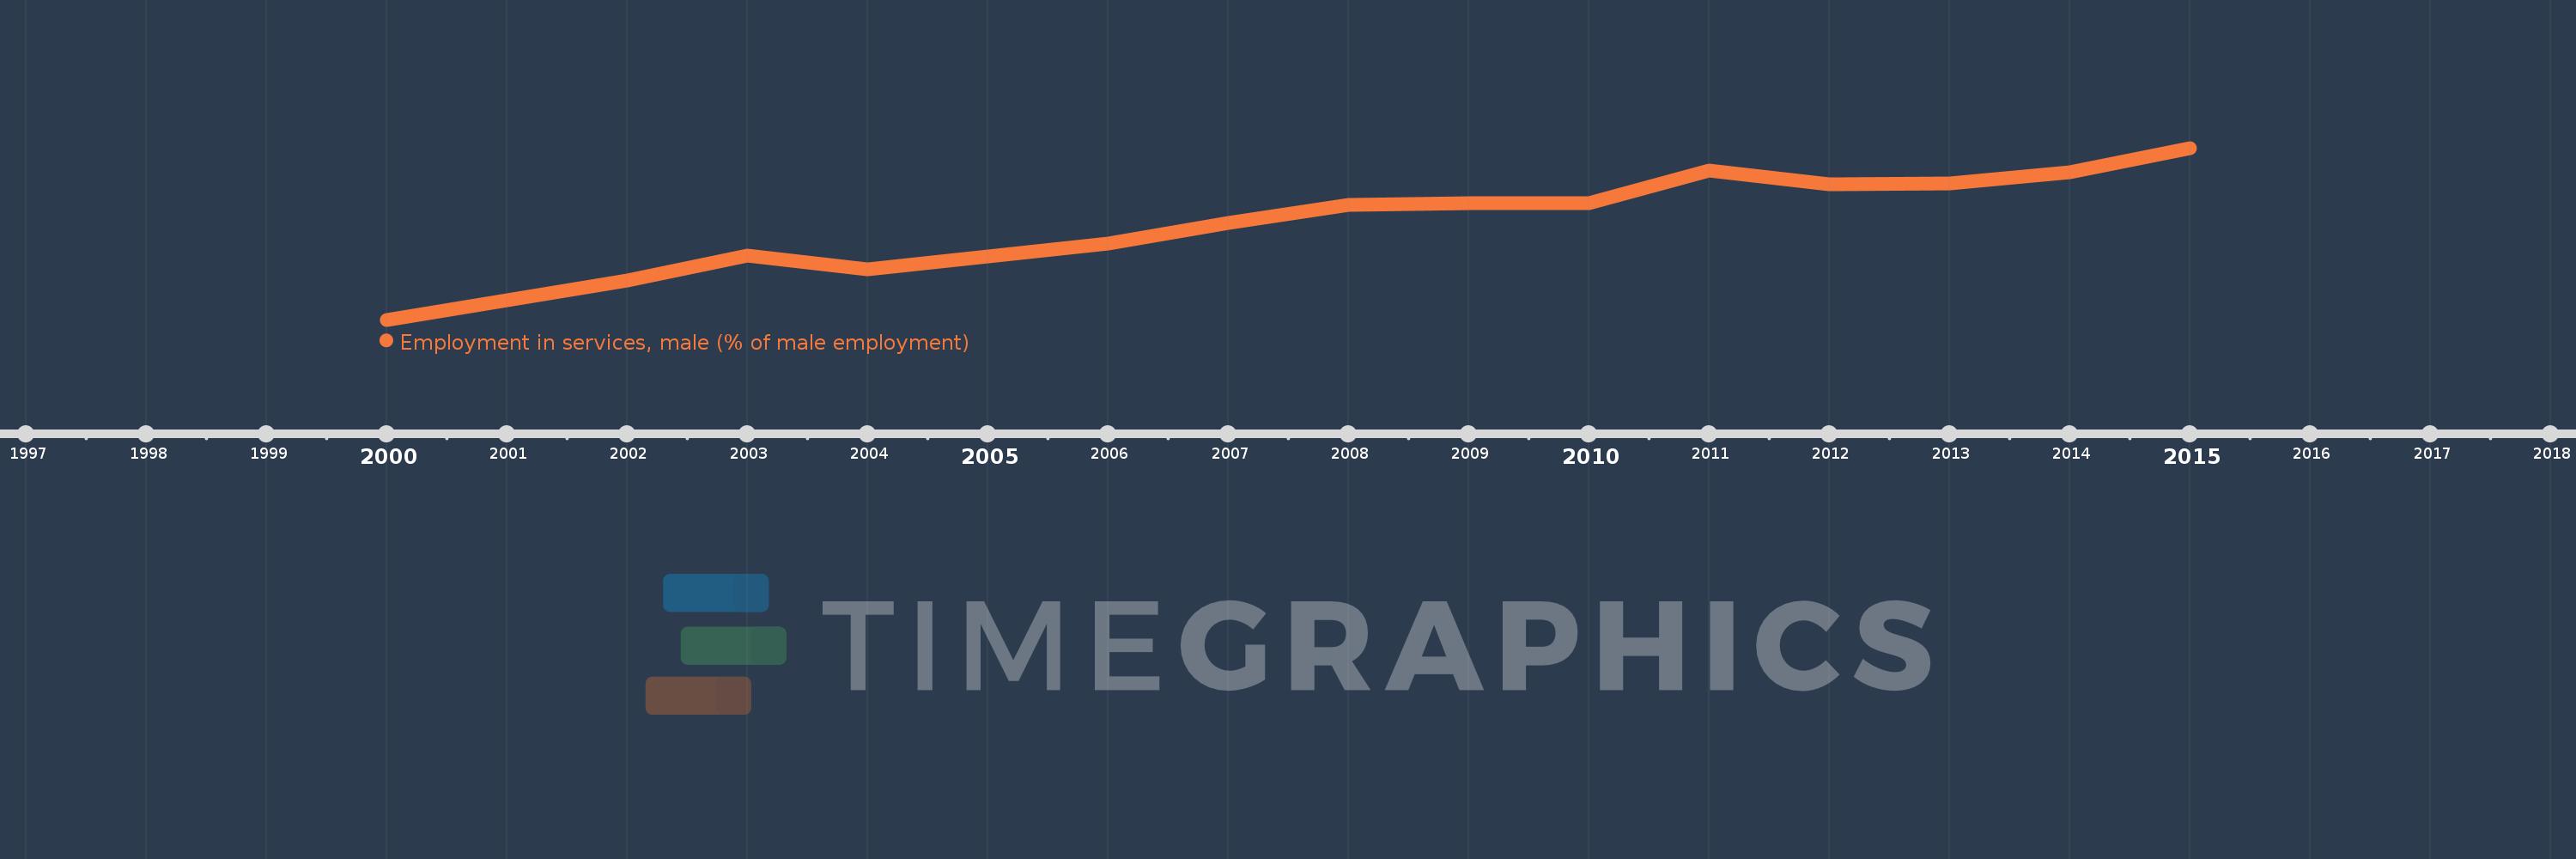
This timeline shows a graph from 2000 to 2015 of Europe & Central Asia (IDA & IBRD countries). No data until 1999. Number of actual observations by date: 16.
Source name:
World Development Indicators
Source organization:
International Labour Organization, Key Indicators of the Labour Market database.
Categories, topics:
Social Protection & Labor, Gender
Last updated:
apr 23, 2017
Indicators value changes by year
Meaning:
47.531
Minimum:
43.683
jan 1, 2000
Maximum:
50.754
jan 1, 2015
At the date of observation
Value
Absolute change
Change from the previous value
jan 1, 2000
43.683
+43.683
0.0%
jan 1, 2001
44.47
+0.788
1.8%
jan 1, 2002
45.294
+0.823
1.85%
jan 1, 2003
46.321
+1.028
2.27%
jan 1, 2004
45.752
-0.569
-1.23%
jan 1, 2005
46.287
+0.534
1.17%
jan 1, 2006
46.807
+0.521
1.13%
jan 1, 2007
47.652
+0.844
1.8%
jan 1, 2008
48.418
+0.766
1.61%
jan 1, 2009
48.472
+0.054
0.11%
jan 1, 2010
48.483
+0.011
0.02%
jan 1, 2011
49.84
+1.357
2.8%
jan 1, 2012
49.247
-0.592
-1.19%
jan 1, 2013
49.287
+0.039
0.08%
jan 1, 2014
49.736
+0.45
0.91%
jan 1, 2015
50.754
+1.018
2.05%
Ranking of countries by current statistics by years
