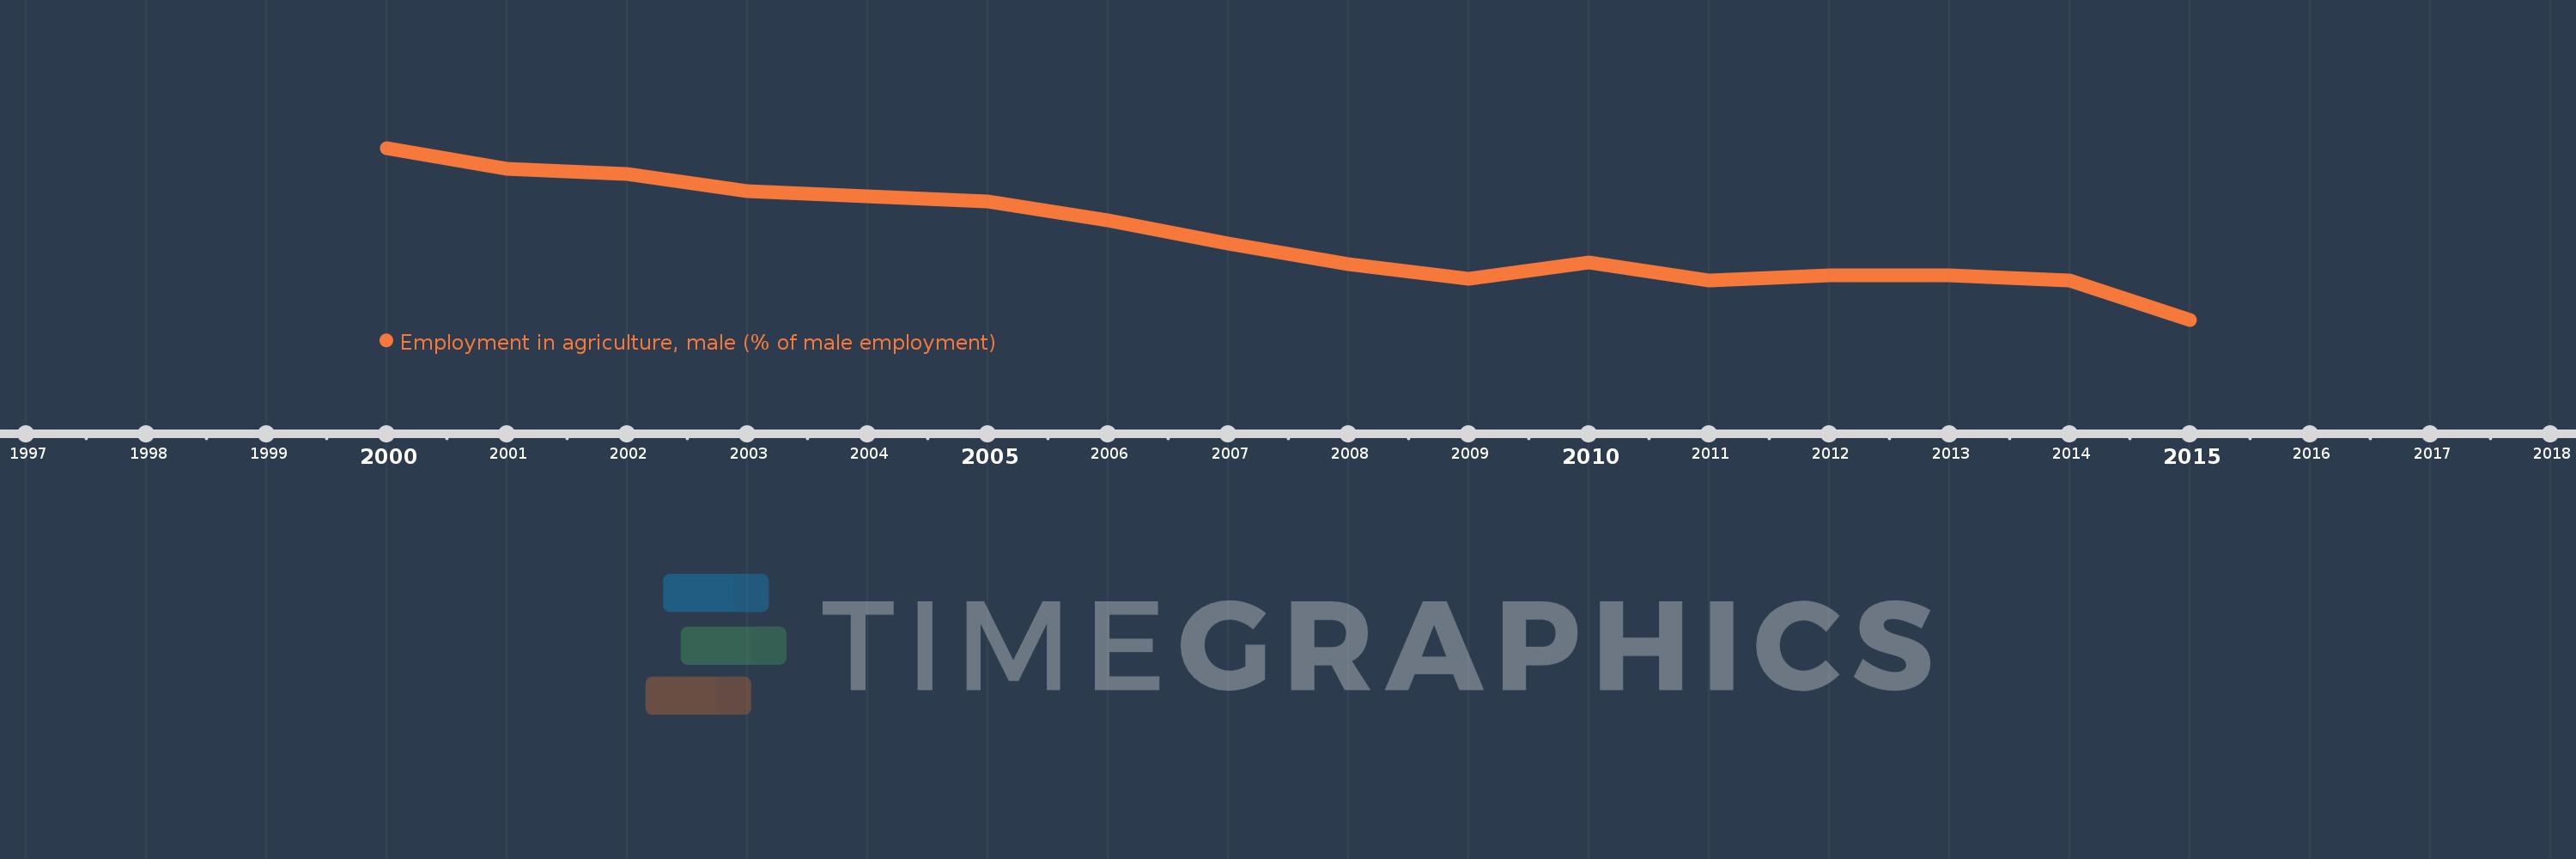
This timeline shows a graph from 2000 to 2015 of Europe & Central Asia (IDA & IBRD countries). No data until 1999. Number of actual observations by date: 16.
Source name:
World Development Indicators
Source organization:
International Labour Organization, Key Indicators of the Labour Market database.
Categories, topics:
Agriculture & Rural Development, Social Protection & Labor, Gender
Last updated:
apr 23, 2017
Indicators value changes by year
Meaning:
17.992
Minimum:
12.185
jan 1, 2015
Maximum:
24.141
jan 1, 2000
At the date of observation
Value
Absolute change
Change from the previous value
jan 1, 2000
24.141
+24.141
0.0%
jan 1, 2001
22.695
-1.446
-5.99%
jan 1, 2002
22.354
-0.341
-1.5%
jan 1, 2003
21.11
-1.245
-5.57%
jan 1, 2004
20.787
-0.322
-1.53%
jan 1, 2005
20.436
-0.352
-1.69%
jan 1, 2006
19.081
-1.355
-6.63%
jan 1, 2007
17.458
-1.623
-8.51%
jan 1, 2008
16.055
-1.402
-8.03%
jan 1, 2009
15.052
-1.003
-6.25%
jan 1, 2010
16.149
+1.097
7.29%
jan 1, 2011
14.904
-1.245
-7.71%
jan 1, 2012
15.301
+0.397
2.67%
jan 1, 2013
15.263
-0.038
-0.25%
jan 1, 2014
14.902
-0.36
-2.36%
jan 1, 2015
12.185
-2.718
-18.24%
Ranking of countries by current statistics by years
