29
/
en
AIzaSyAYiBZKx7MnpbEhh9jyipgxe19OcubqV5w
April 1, 2024
31861
Europe & Central Asia (excluding high income)
ECA
false
2
1
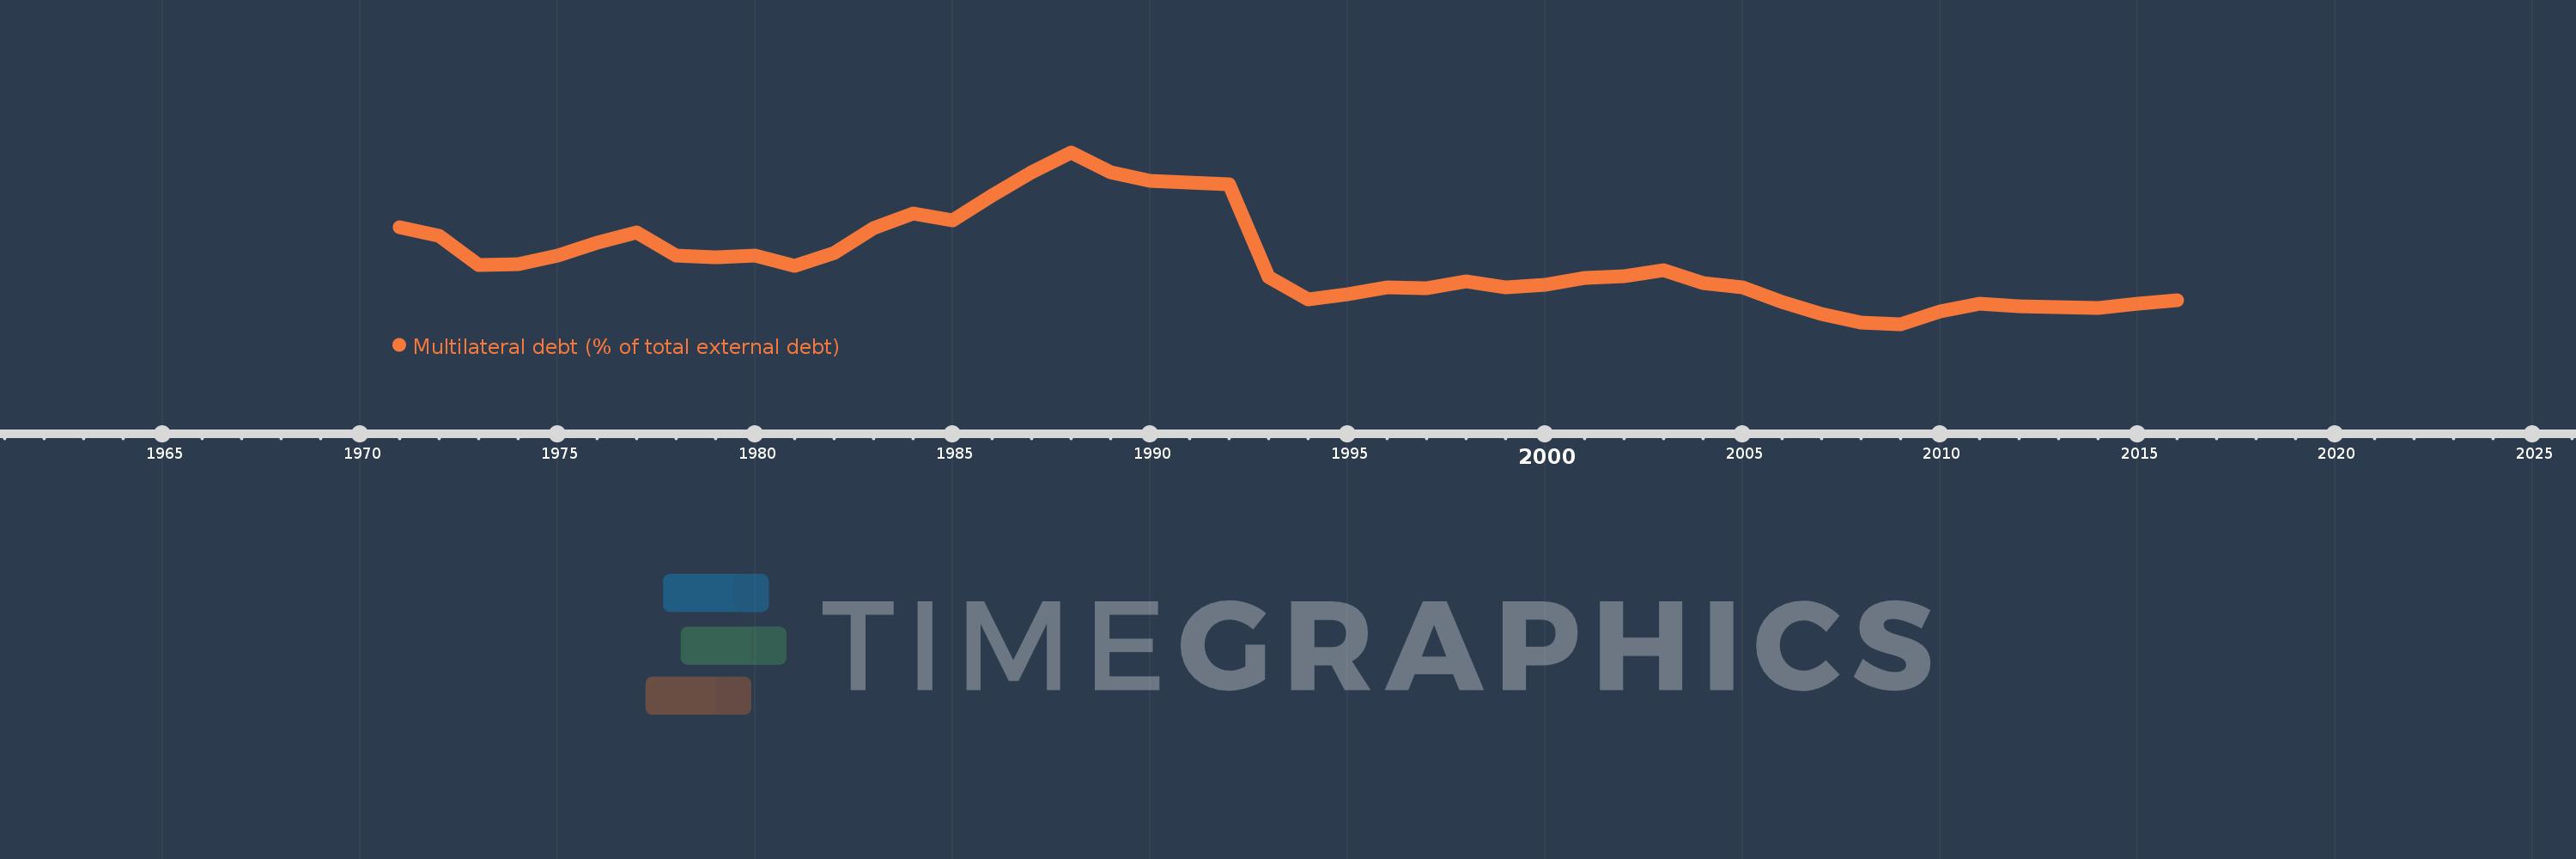
Multilateral debt (% of total external debt)
2016,2015,2014,2013,2012,2011,2010,2009,2008,2007,2006,2005,2004,2003,2002,2001,2000,1999,1998,1997,1996,1995,1994,1993,1992,1991,1990,1989,1988,1987,1986,1985,1984,1983,1982,1981,1980,1979,1978,1977,1976,1975,1974,1973,1972,1971
This statistics in other country:
Timeline:
This timeline shows a graph from 1971 to 2016 of Europe & Central Asia (excluding high income). No data until 1970. Number of actual observations by date: 46.
Source name:
World Development Indicators
Source organization:
World Bank, International Debt Statistics.
Categories, topics:
External Debt
Last updated:
apr 23, 2017
Indicators value changes by year
Maximum:
18.843
jan 1, 1988
At the date of observation
Value
Absolute change
Change from previous value
jan 1, 1971
12.5
+12.5
0.0%
jan 1, 1972
11.749
-0.751
-6.01%
jan 1, 1973
9.251
-2.498
-21.26%
jan 1, 1974
9.357
+0.106
1.14%
jan 1, 1975
10.065
+0.708
7.57%
jan 1, 1976
11.181
+1.116
11.09%
jan 1, 1977
12.014
+0.834
7.46%
jan 1, 1978
10.065
-1.949
-16.22%
jan 1, 1979
9.877
-0.188
-1.87%
jan 1, 1980
10.072
+0.195
1.97%
jan 1, 1981
9.206
-0.866
-8.59%
jan 1, 1982
10.288
+1.082
11.75%
jan 1, 1983
12.365
+2.077
20.19%
jan 1, 1984
13.657
+1.292
10.45%
jan 1, 1985
13.022
-0.635
-4.65%
jan 1, 1986
15.188
+2.166
16.63%
jan 1, 1987
17.122
+1.934
12.73%
jan 1, 1988
18.843
+1.721
10.05%
jan 1, 1989
17.172
-1.671
-8.87%
jan 1, 1990
16.417
-0.755
-4.4%
jan 1, 1991
16.275
-0.142
-0.86%
jan 1, 1992
16.154
-0.121
-0.74%
jan 1, 1993
8.194
-7.96
-49.28%
jan 1, 1994
6.326
-1.867
-22.79%
jan 1, 1995
6.772
+0.446
7.05%
jan 1, 1996
7.36
+0.588
8.69%
jan 1, 1997
7.276
-0.084
-1.15%
jan 1, 1998
7.833
+0.557
7.66%
jan 1, 1999
7.325
-0.508
-6.49%
jan 1, 2000
7.59
+0.265
3.62%
jan 1, 2001
8.145
+0.555
7.32%
jan 1, 2002
8.313
+0.168
2.07%
jan 1, 2003
8.789
+0.476
5.72%
jan 1, 2004
7.738
-1.052
-11.97%
jan 1, 2005
7.33
-0.407
-5.26%
jan 1, 2006
6.088
-1.243
-16.95%
jan 1, 2007
5.091
-0.997
-16.37%
jan 1, 2008
4.366
-0.725
-14.24%
jan 1, 2009
4.208
-0.158
-3.62%
jan 1, 2010
5.308
+1.099
26.13%
jan 1, 2011
5.938
+0.63
11.87%
jan 1, 2012
5.728
-0.21
-3.54%
jan 1, 2013
5.652
-0.076
-1.32%
jan 1, 2014
5.56
-0.092
-1.62%
jan 1, 2015
5.933
+0.373
6.7%
jan 1, 2016
6.238
+0.305
5.14%
Ranking of countries by current statistics by years


Comments: