29
/
en
AIzaSyAYiBZKx7MnpbEhh9jyipgxe19OcubqV5w
April 1, 2024
31729
Europe & Central Asia (excluding high income)
ECA
false
2
1
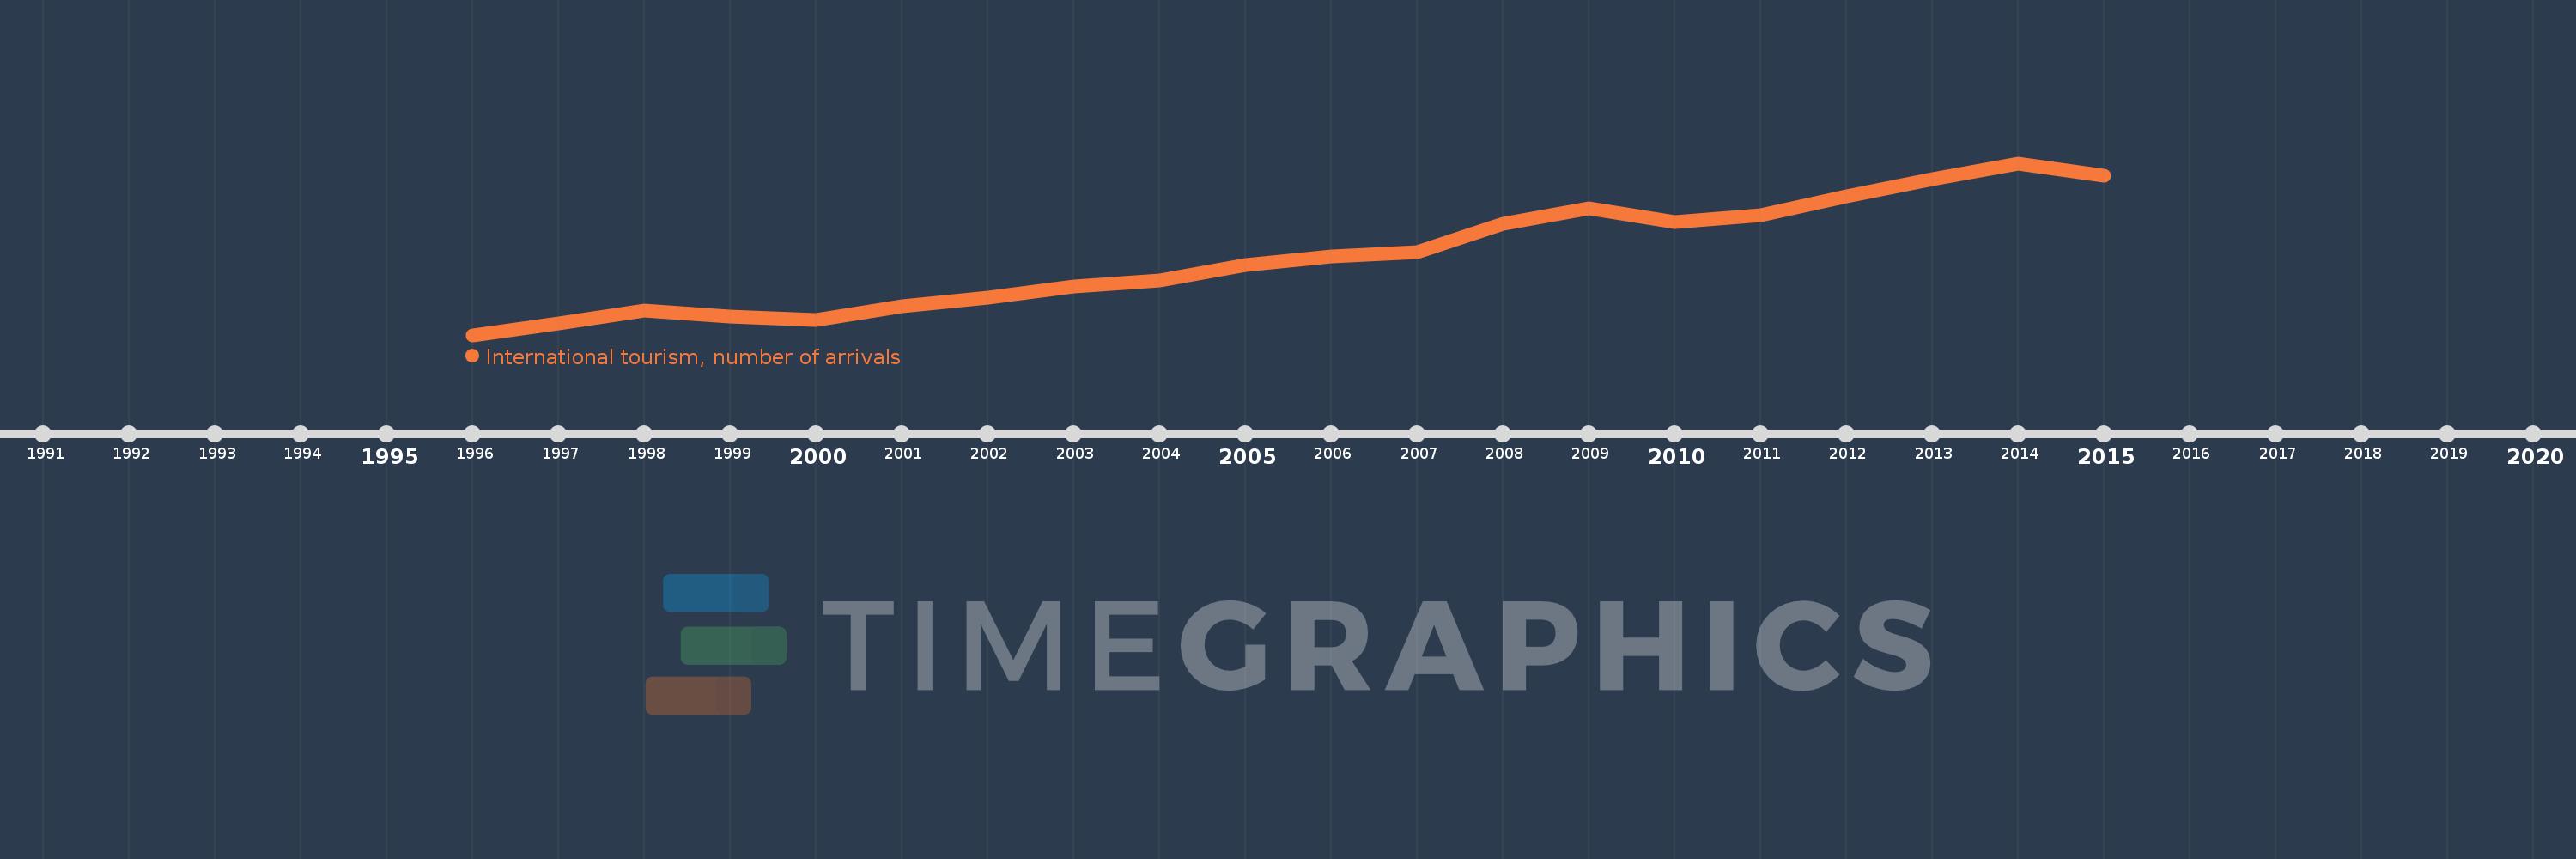
International tourism, number of arrivals
2015,2014,2013,2012,2011,2010,2009,2008,2007,2006,2005,2004,2003,2002,2001,2000,1999,1998,1997,1996
This statistics in other country:
AlbaniaAlgeriaAmerican SamoaAndorraAngolaAntigua and BarbudaArab WorldArgentinaArmeniaArubaAustraliaAustriaAzerbaijanBahamas, TheBahrainBangladeshBarbadosBelarusBelgiumBelizeBeninBermudaBhutanBoliviaBosnia and HerzegovinaBotswanaBrazilBritish Virgin IslandsBrunei DarussalamBulgariaBurkina FasoBurundiCabo VerdeCambodiaCameroonCanadaCaribbean small statesCayman IslandsCentral African RepublicCentral Europe and the BalticsChadChileChinaColombiaComorosCongo, Dem. Rep.Congo, Rep.Costa RicaCote d'IvoireCroatiaCubaCuracaoCyprusCzech RepublicDenmarkDjiboutiDominicaDominican RepublicEarly-demographic dividendEast Asia & PacificEast Asia & Pacific (excluding high income)East Asia & Pacific (IDA & IBRD countries)EcuadorEgypt, Arab Rep.El SalvadorEritreaEstoniaEthiopiaEuro areaEurope & Central AsiaEurope & Central Asia (excluding high income)Europe & Central Asia (IDA & IBRD countries)European UnionFijiFinlandFragile and conflict affected situationsFranceFrench PolynesiaGabonGambia, TheGeorgiaGermanyGhanaGreeceGrenadaGuamGuatemalaGuineaGuinea-BissauGuyanaHaitiHeavily indebted poor countries (HIPC)High incomeHondurasHong Kong SAR, ChinaHungaryIBRD onlyIcelandIDA & IBRD totalIDA blendIDA onlyIDA totalIndiaIndonesiaIran, Islamic Rep.IraqIrelandIsraelItalyJamaicaJapanJordanKazakhstanKenyaKiribatiKorea, Rep.KuwaitKyrgyz RepublicLao PDRLate-demographic dividendLatin America & Caribbean Latin America & Caribbean (excluding high income)Latin America & the Caribbean (IDA & IBRD countries)LatviaLeast developed countries: UN classificationLebanonLesothoLibyaLiechtensteinLithuaniaLow & middle incomeLow incomeLower middle incomeLuxembourgMacao SAR, ChinaMacedonia, FYRMadagascarMalawiMalaysiaMaldivesMaliMaltaMarshall IslandsMauritaniaMauritiusMexicoMicronesia, Fed. Sts.Middle East & North AfricaMiddle East & North Africa (excluding high income)Middle East & North Africa (IDA & IBRD countries)Middle incomeMoldovaMonacoMongoliaMontenegroMoroccoMozambiqueMyanmarNamibiaNepalNetherlandsNew CaledoniaNew ZealandNicaraguaNigerNigeriaNorth AmericaNorthern Mariana IslandsNorwayOECD membersOmanOther small statesPacific island small statesPakistanPalauPanamaPapua New GuineaParaguayPeruPhilippinesPolandPortugalPost-demographic dividendPre-demographic dividendPuerto RicoQatarRomaniaRussian FederationRwandaSamoaSan MarinoSao Tome and PrincipeSaudi ArabiaSenegalSerbiaSeychellesSierra LeoneSingaporeSint Maarten (Dutch part)Slovak RepublicSloveniaSmall statesSolomon IslandsSouth AfricaSouth AsiaSouth Asia (IDA & IBRD)SpainSri LankaSt. Kitts and NevisSt. LuciaSt. Vincent and the GrenadinesSub-Saharan Africa Sub-Saharan Africa (excluding high income)Sub-Saharan Africa (IDA & IBRD countries)SudanSurinameSwazilandSwedenSwitzerlandSyrian Arab RepublicTajikistanTanzaniaThailandTimor-LesteTogoTongaTrinidad and TobagoTunisiaTurkeyTurkmenistanTurks and Caicos IslandsTuvaluUgandaUkraineUnited Arab EmiratesUnited KingdomUnited StatesUpper middle incomeUruguayUzbekistanVanuatuVenezuela, RBVietnamVirgin Islands (U.S.)West Bank and GazaWorldYemen, Rep.ZambiaZimbabwe Timeline:
This timeline shows a graph from 1996 to 2015 of Europe & Central Asia (excluding high income). No data until 1995. Number of actual observations by date: 20.
Source name:
World Development Indicators
Source organization:
World Tourism Organization, Yearbook of Tourism Statistics, Compendium of Tourism Statistics and data files.
Categories, topics:
Private Sector, Trade
Last updated:
apr 23, 2017
Indicators value changes by year
Minimum:
33.177 mln
jan 1, 1996
Maximum:
134.738 mln
jan 1, 2014
At the date of observation
Value
Absolute change
Change from previous value
jan 1, 1996
33.177 mln
+33.177 mln
0.0%
jan 1, 1997
39.865 mln
+6.689 mln
20.16%
jan 1, 1998
47.665 mln
+7.8 mln
19.57%
jan 1, 1999
44.129 mln
-3.536 mln
-7.42%
jan 1, 2000
42.252 mln
-1.878 mln
-4.26%
jan 1, 2001
50.355 mln
+8.103 mln
19.18%
jan 1, 2002
55.325 mln
+4.97 mln
9.87%
jan 1, 2003
61.908 mln
+6.583 mln
11.9%
jan 1, 2004
65.188 mln
+3.281 mln
5.3%
jan 1, 2005
74.43 mln
+9.242 mln
14.18%
jan 1, 2006
79.772 mln
+5.342 mln
7.18%
jan 1, 2007
82.317 mln
+2.544 mln
3.19%
jan 1, 2008
99.144 mln
+16.827 mln
20.44%
jan 1, 2009
108.14 mln
+8.997 mln
9.07%
jan 1, 2010
100.07 mln
-8.07 mln
-7.46%
jan 1, 2011
103.861 mln
+3.791 mln
3.79%
jan 1, 2012
114.957 mln
+11.096 mln
10.68%
jan 1, 2013
125.297 mln
+10.34 mln
8.99%
jan 1, 2014
134.738 mln
+9.441 mln
7.54%
jan 1, 2015
127.4 mln
-7.338 mln
-5.45%
Ranking of countries by current statistics by years


Comments: