29
/
en
AIzaSyAYiBZKx7MnpbEhh9jyipgxe19OcubqV5w
April 1, 2024
31452
Europe & Central Asia (excluding high income)
ECA
false
2
1
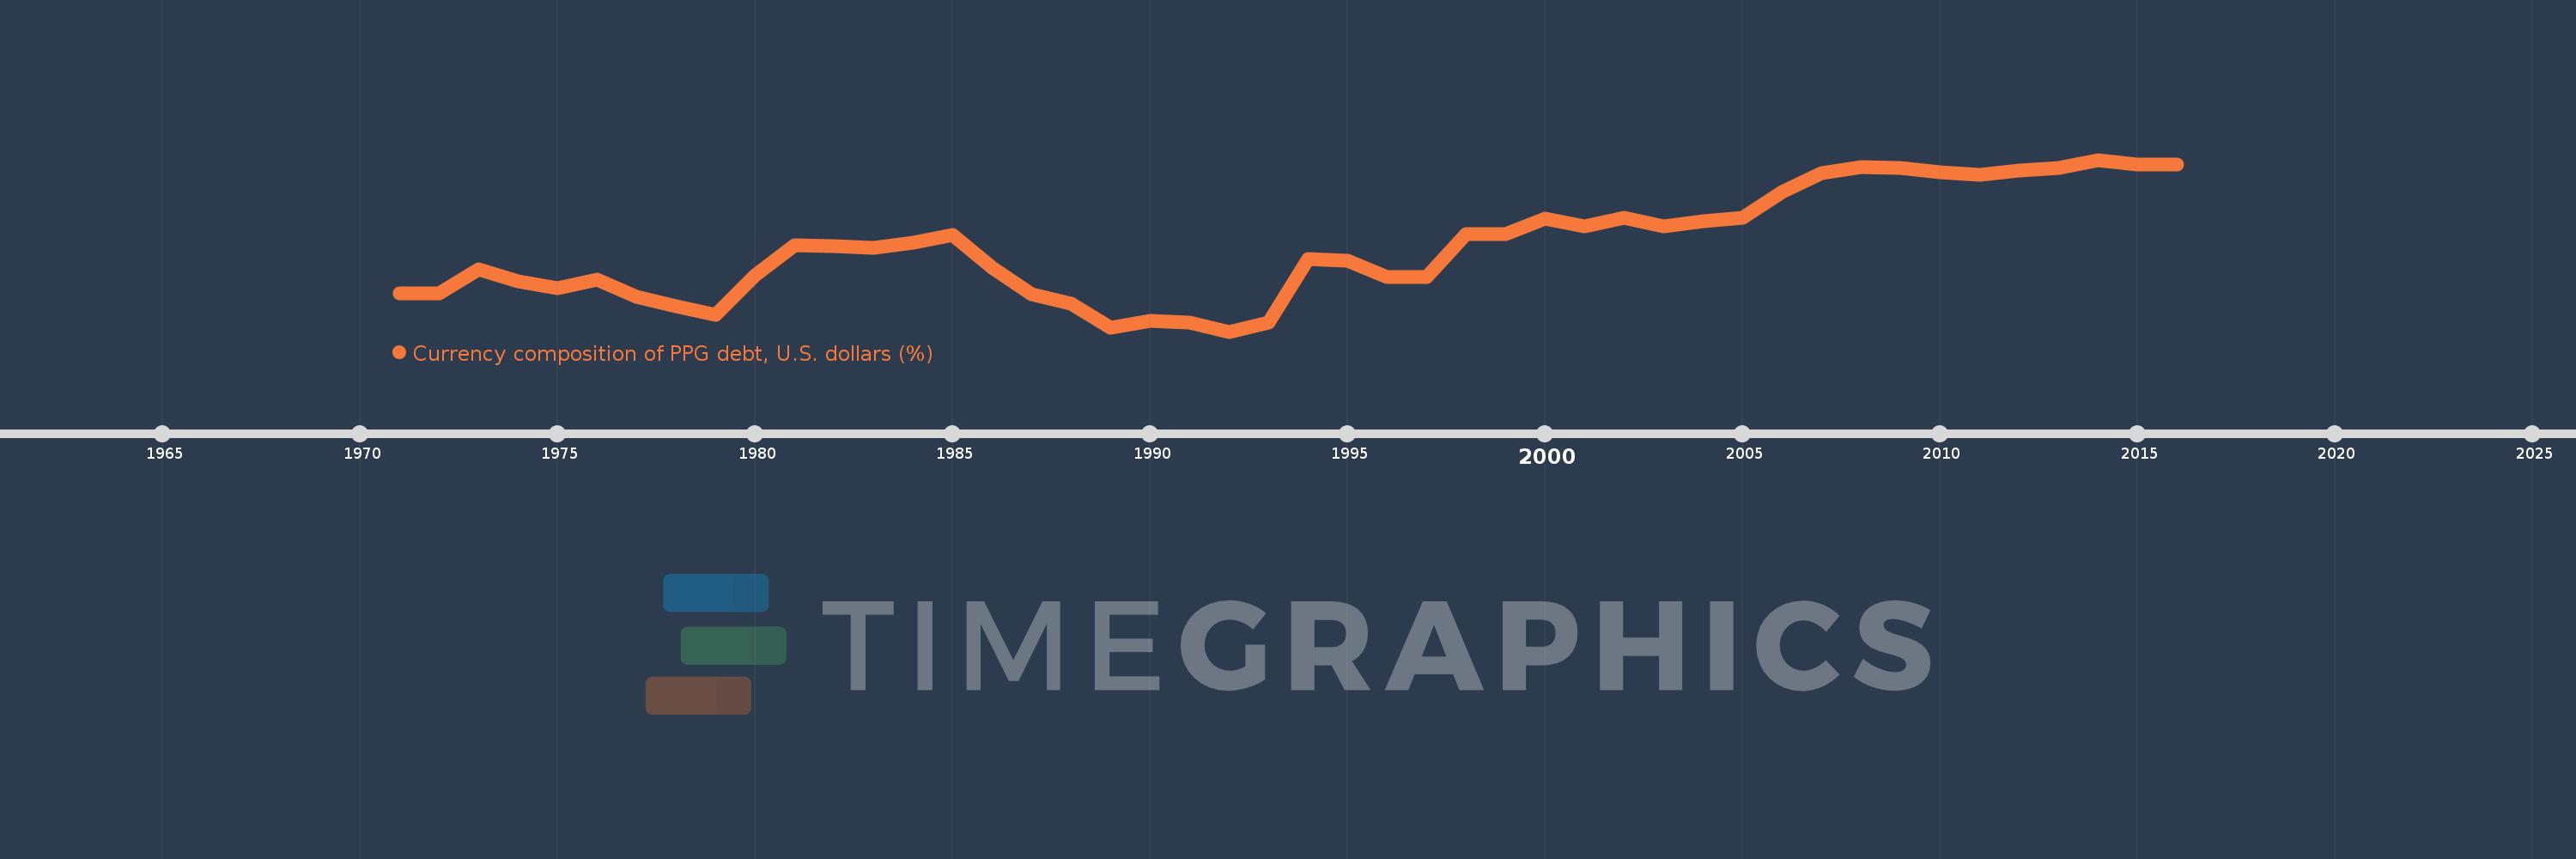
Currency composition of PPG debt, U.S. dollars (%)
2016,2015,2014,2013,2012,2011,2010,2009,2008,2007,2006,2005,2004,2003,2002,2001,2000,1999,1998,1997,1996,1995,1994,1993,1992,1991,1990,1989,1988,1987,1986,1985,1984,1983,1982,1981,1980,1979,1978,1977,1976,1975,1974,1973,1972,1971
This statistics in other country:
Timeline:
This timeline shows a graph from 1971 to 2016 of Europe & Central Asia (excluding high income). No data until 1970. Number of actual observations by date: 46.
Source name:
World Development Indicators
Source organization:
World Bank, International Debt Statistics.
Categories, topics:
External Debt
Last updated:
apr 23, 2017
Indicators value changes by year
Minimum:
33.095
jan 1, 1992
Maximum:
78.166
jan 1, 2014
At the date of observation
Value
Absolute change
Change from previous value
jan 1, 1971
43.224
+43.224
0.0%
jan 1, 1972
43.07
-0.154
-0.36%
jan 1, 1973
49.476
+6.406
14.87%
jan 1, 1974
46.274
-3.202
-6.47%
jan 1, 1975
44.528
-1.746
-3.77%
jan 1, 1976
46.626
+2.098
4.71%
jan 1, 1977
42.255
-4.37
-9.37%
jan 1, 1978
39.831
-2.425
-5.74%
jan 1, 1979
37.421
-2.41
-6.05%
jan 1, 1980
47.902
+10.481
28.01%
jan 1, 1981
55.72
+7.819
16.32%
jan 1, 1982
55.513
-0.207
-0.37%
jan 1, 1983
54.995
-0.518
-0.93%
jan 1, 1984
56.412
+1.417
2.58%
jan 1, 1985
58.413
+2.001
3.55%
jan 1, 1986
49.904
-8.509
-14.57%
jan 1, 1987
42.894
-7.011
-14.05%
jan 1, 1988
40.372
-2.522
-5.88%
jan 1, 1989
34.179
-6.192
-15.34%
jan 1, 1990
35.846
+1.666
4.88%
jan 1, 1991
35.464
-0.382
-1.06%
jan 1, 1992
33.095
-2.369
-6.68%
jan 1, 1993
35.553
+2.458
7.43%
jan 1, 1994
52.208
+16.655
46.85%
jan 1, 1995
51.656
-0.552
-1.06%
jan 1, 1996
47.481
-4.175
-8.08%
jan 1, 1997
47.374
-0.107
-0.23%
jan 1, 1998
58.585
+11.211
23.67%
jan 1, 1999
58.588
+0.003
0.0%
jan 1, 2000
62.731
+4.143
7.07%
jan 1, 2001
60.642
-2.089
-3.33%
jan 1, 2002
63.062
+2.42
3.99%
jan 1, 2003
60.744
-2.318
-3.68%
jan 1, 2004
62.025
+1.28
2.11%
jan 1, 2005
62.887
+0.862
1.39%
jan 1, 2006
69.751
+6.863
10.91%
jan 1, 2007
74.57
+4.82
6.91%
jan 1, 2008
76.342
+1.772
2.38%
jan 1, 2009
76.082
-0.26
-0.34%
jan 1, 2010
74.793
-1.289
-1.69%
jan 1, 2011
74.179
-0.614
-0.82%
jan 1, 2012
75.258
+1.079
1.45%
jan 1, 2013
76.061
+0.803
1.07%
jan 1, 2014
78.166
+2.104
2.77%
jan 1, 2015
76.973
-1.192
-1.53%
jan 1, 2016
76.996
+0.023
0.03%
Ranking of countries by current statistics by years


Comments: