29
/
en
AIzaSyAYiBZKx7MnpbEhh9jyipgxe19OcubqV5w
April 1, 2024
31326
Europe & Central Asia (excluding high income)
ECA
false
2
1
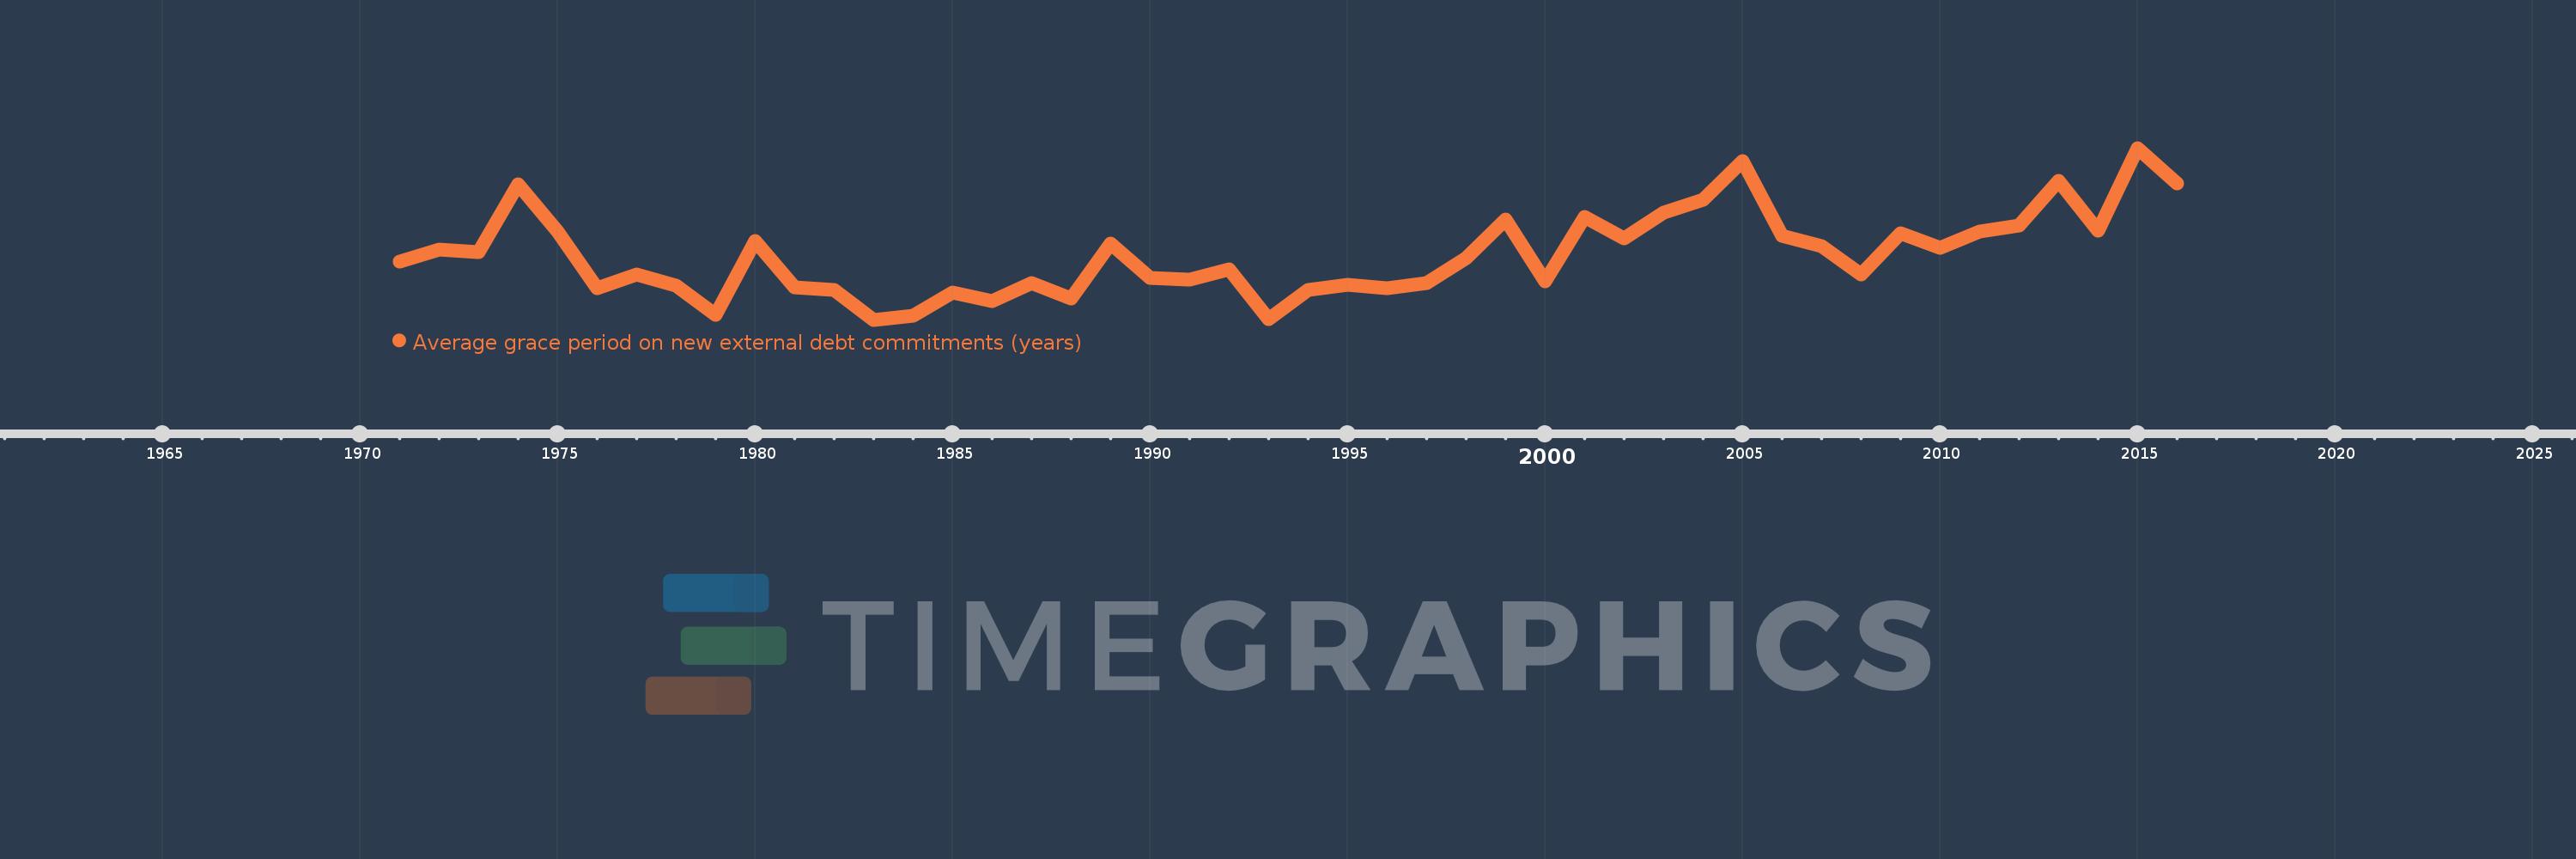
Average grace period on new external debt commitments (years)
2016,2015,2014,2013,2012,2011,2010,2009,2008,2007,2006,2005,2004,2003,2002,2001,2000,1999,1998,1997,1996,1995,1994,1993,1992,1991,1990,1989,1988,1987,1986,1985,1984,1983,1982,1981,1980,1979,1978,1977,1976,1975,1974,1973,1972,1971
This statistics in other country:
Timeline:
This timeline shows a graph from 1971 to 2016 of Europe & Central Asia (excluding high income). No data until 1970. Number of actual observations by date: 46.
Source name:
World Development Indicators
Source organization:
World Bank, International Debt Statistics.
Categories, topics:
External Debt
Last updated:
apr 23, 2017
Indicators value changes by year
At the date of observation
Value
Absolute change
Change from previous value
jan 1, 1971
5.145
+5.145
0.0%
jan 1, 1972
5.61
+0.465
9.03%
jan 1, 1973
5.519
-0.09
-1.61%
jan 1, 1974
7.979
+2.459
44.56%
jan 1, 1975
6.255
-1.724
-21.61%
jan 1, 1976
4.201
-2.054
-32.83%
jan 1, 1977
4.695
+0.494
11.75%
jan 1, 1978
4.277
-0.418
-8.89%
jan 1, 1979
3.215
-1.062
-24.83%
jan 1, 1980
5.898
+2.683
83.45%
jan 1, 1981
4.207
-1.691
-28.68%
jan 1, 1982
4.127
-0.08
-1.91%
jan 1, 1983
3.044
-1.082
-26.23%
jan 1, 1984
3.202
+0.157
5.17%
jan 1, 1985
4.038
+0.837
26.13%
jan 1, 1986
3.731
-0.308
-7.62%
jan 1, 1987
4.365
+0.634
17.0%
jan 1, 1988
3.801
-0.564
-12.93%
jan 1, 1989
5.81
+2.009
52.87%
jan 1, 1990
4.566
-1.244
-21.41%
jan 1, 1991
4.512
-0.053
-1.17%
jan 1, 1992
4.884
+0.371
8.22%
jan 1, 1993
3.077
-1.807
-37.0%
jan 1, 1994
4.113
+1.036
33.67%
jan 1, 1995
4.304
+0.191
4.65%
jan 1, 1996
4.206
-0.098
-2.27%
jan 1, 1997
4.387
+0.18
4.28%
jan 1, 1998
5.273
+0.886
20.2%
jan 1, 1999
6.706
+1.434
27.19%
jan 1, 2000
4.455
-2.252
-33.58%
jan 1, 2001
6.793
+2.338
52.49%
jan 1, 2002
6.01
-0.783
-11.53%
jan 1, 2003
6.952
+0.942
15.68%
jan 1, 2004
7.41
+0.458
6.59%
jan 1, 2005
8.812
+1.402
18.91%
jan 1, 2006
6.099
-2.713
-30.79%
jan 1, 2007
5.71
-0.389
-6.39%
jan 1, 2008
4.694
-1.015
-17.78%
jan 1, 2009
6.196
+1.501
31.98%
jan 1, 2010
5.65
-0.546
-8.81%
jan 1, 2011
6.269
+0.619
10.96%
jan 1, 2012
6.475
+0.206
3.29%
jan 1, 2013
8.111
+1.637
25.28%
jan 1, 2014
6.281
-1.83
-22.56%
jan 1, 2015
9.294
+3.012
47.95%
jan 1, 2016
7.991
-1.303
-14.02%
Ranking of countries by current statistics by years


Comments: