29
/
en
AIzaSyAYiBZKx7MnpbEhh9jyipgxe19OcubqV5w
April 1, 2024
30540
Europe & Central Asia
ECS
false
2
1
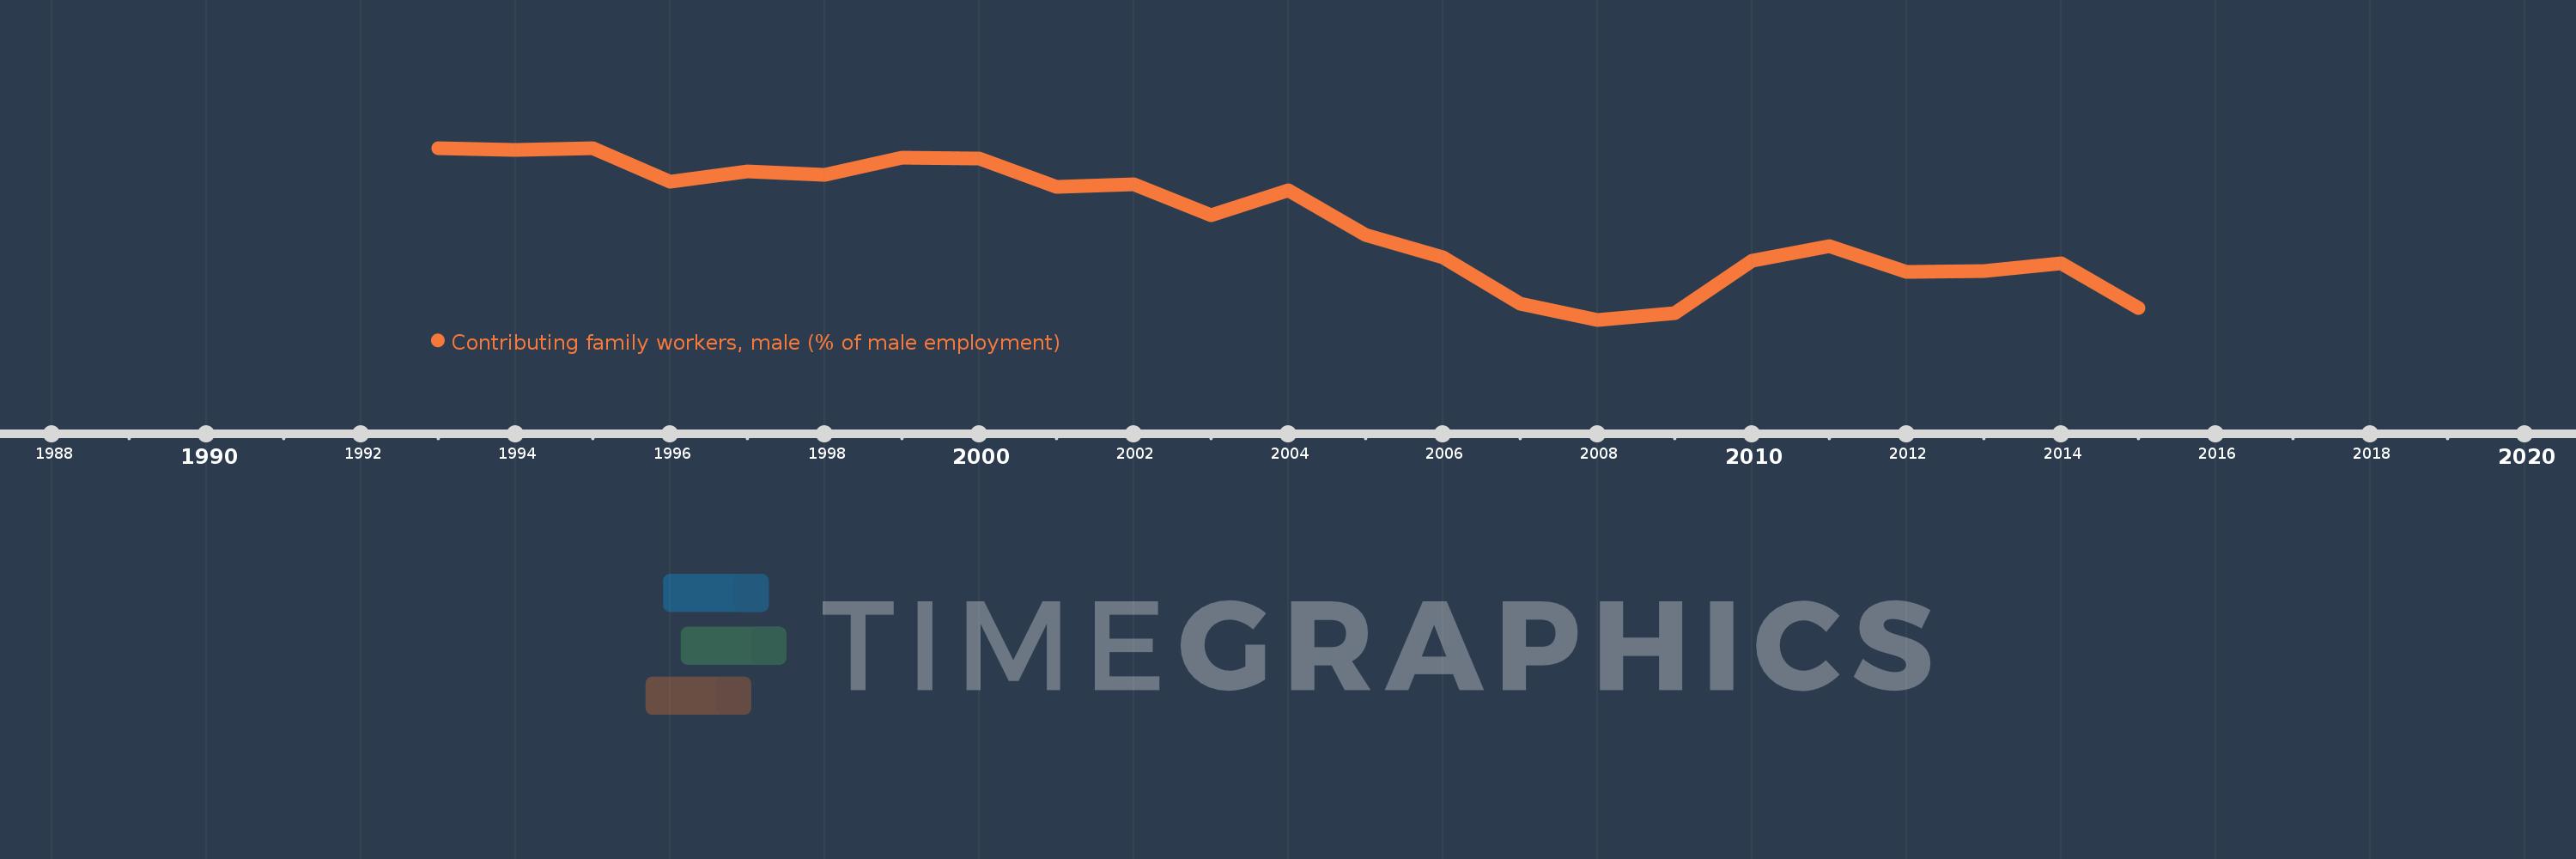
Contributing family workers, male (% of male employment)
2015,2014,2013,2012,2011,2010,2009,2008,2007,2006,2005,2004,2003,2002,2001,2000,1999,1998,1997,1996,1995,1994,1993
This statistics in other country:
AlbaniaAlgeriaAmerican SamoaAntigua and BarbudaArgentinaArmeniaArubaAustraliaAustriaAzerbaijanBahamas, TheBahrainBangladeshBarbadosBelarusBelgiumBelizeBeninBermudaBhutanBoliviaBosnia and HerzegovinaBotswanaBrazilBritish Virgin IslandsBrunei DarussalamBulgariaBurkina FasoBurundiCabo VerdeCambodiaCameroonCanadaCaribbean small statesCayman IslandsCentral Europe and the BalticsChadChileColombiaCongo, Rep.Costa RicaCote d'IvoireCroatiaCyprusCzech RepublicDenmarkDominicaDominican RepublicEarly-demographic dividendEcuadorEgypt, Arab Rep.El SalvadorEquatorial GuineaEstoniaEthiopiaEuro areaEurope & Central AsiaEurope & Central Asia (excluding high income)Europe & Central Asia (IDA & IBRD countries)European UnionFijiFinlandFranceFrench PolynesiaGabonGambia, TheGeorgiaGermanyGhanaGreeceGrenadaGuatemalaGuineaHaitiHigh incomeHondurasHong Kong SAR, ChinaHungaryIcelandIndiaIndonesiaIran, Islamic Rep.IrelandIsraelItalyJamaicaJapanJordanKazakhstanKenyaKiribatiKorea, Rep.KosovoKuwaitKyrgyz RepublicLao PDRLatin America & Caribbean Latin America & Caribbean (excluding high income)Latin America & the Caribbean (IDA & IBRD countries)LatviaLebanonLesothoLiberiaLithuaniaLower middle incomeLuxembourgMacao SAR, ChinaMacedonia, FYRMadagascarMalawiMalaysiaMaldivesMaliMaltaMarshall IslandsMauritiusMexicoMiddle East & North Africa (excluding high income)Middle East & North Africa (IDA & IBRD countries)MoldovaMongoliaMontenegroMoroccoMozambiqueNamibiaNepalNetherlandsNew CaledoniaNew ZealandNicaraguaNigerNorth AmericaNorwayOECD membersPakistanPanamaParaguayPeruPhilippinesPolandPortugalPost-demographic dividendPuerto RicoQatarRomaniaRussian FederationRwandaSamoaSan MarinoSao Tome and PrincipeSaudi ArabiaSenegalSerbiaSeychellesSierra LeoneSingaporeSlovak RepublicSloveniaSouth AfricaSouth AsiaSouth Asia (IDA & IBRD)SpainSri LankaSt. Kitts and NevisSt. LuciaSt. Vincent and the GrenadinesSurinameSwazilandSwedenSwitzerlandSyrian Arab RepublicTajikistanTanzaniaThailandTimor-LesteTogoTongaTrinidad and TobagoTunisiaTurkeyTuvaluUgandaUkraineUnited Arab EmiratesUnited KingdomUnited StatesUruguayVanuatuVenezuela, RBVietnamWest Bank and GazaYemen, Rep.ZambiaZimbabwe Timeline:
This timeline shows a graph from 1993 to 2015 of Europe & Central Asia. No data until 1992. Number of actual observations by date: 23.
Source name:
World Development Indicators
Source organization:
International Labour Organization, Key Indicators of the Labour Market database.
Categories, topics:
Social Protection & Labor, Gender
Last updated:
apr 23, 2017
Indicators value changes by year
At the date of observation
Value
Absolute change
Change from previous value
jan 1, 1993
2.443
+2.443
0.0%
jan 1, 1994
2.428
-0.015
-0.62%
jan 1, 1995
2.44
+0.012
0.49%
jan 1, 1996
2.199
-0.241
-9.89%
jan 1, 1997
2.273
+0.074
3.38%
jan 1, 1998
2.248
-0.025
-1.12%
jan 1, 1999
2.372
+0.124
5.53%
jan 1, 2000
2.364
-0.008
-0.35%
jan 1, 2001
2.166
-0.197
-8.35%
jan 1, 2002
2.181
+0.015
0.68%
jan 1, 2003
1.959
-0.222
-10.17%
jan 1, 2004
2.138
+0.179
9.12%
jan 1, 2005
1.82
-0.318
-14.87%
jan 1, 2006
1.657
-0.163
-8.95%
jan 1, 2007
1.32
-0.337
-20.32%
jan 1, 2008
1.207
-0.114
-8.61%
jan 1, 2009
1.255
+0.048
4.02%
jan 1, 2010
1.634
+0.379
30.2%
jan 1, 2011
1.737
+0.103
6.31%
jan 1, 2012
1.553
-0.185
-10.62%
jan 1, 2013
1.56
+0.007
0.43%
jan 1, 2014
1.611
+0.051
3.28%
jan 1, 2015
1.291
-0.32
-19.85%
Ranking of countries by current statistics by years


Comments: