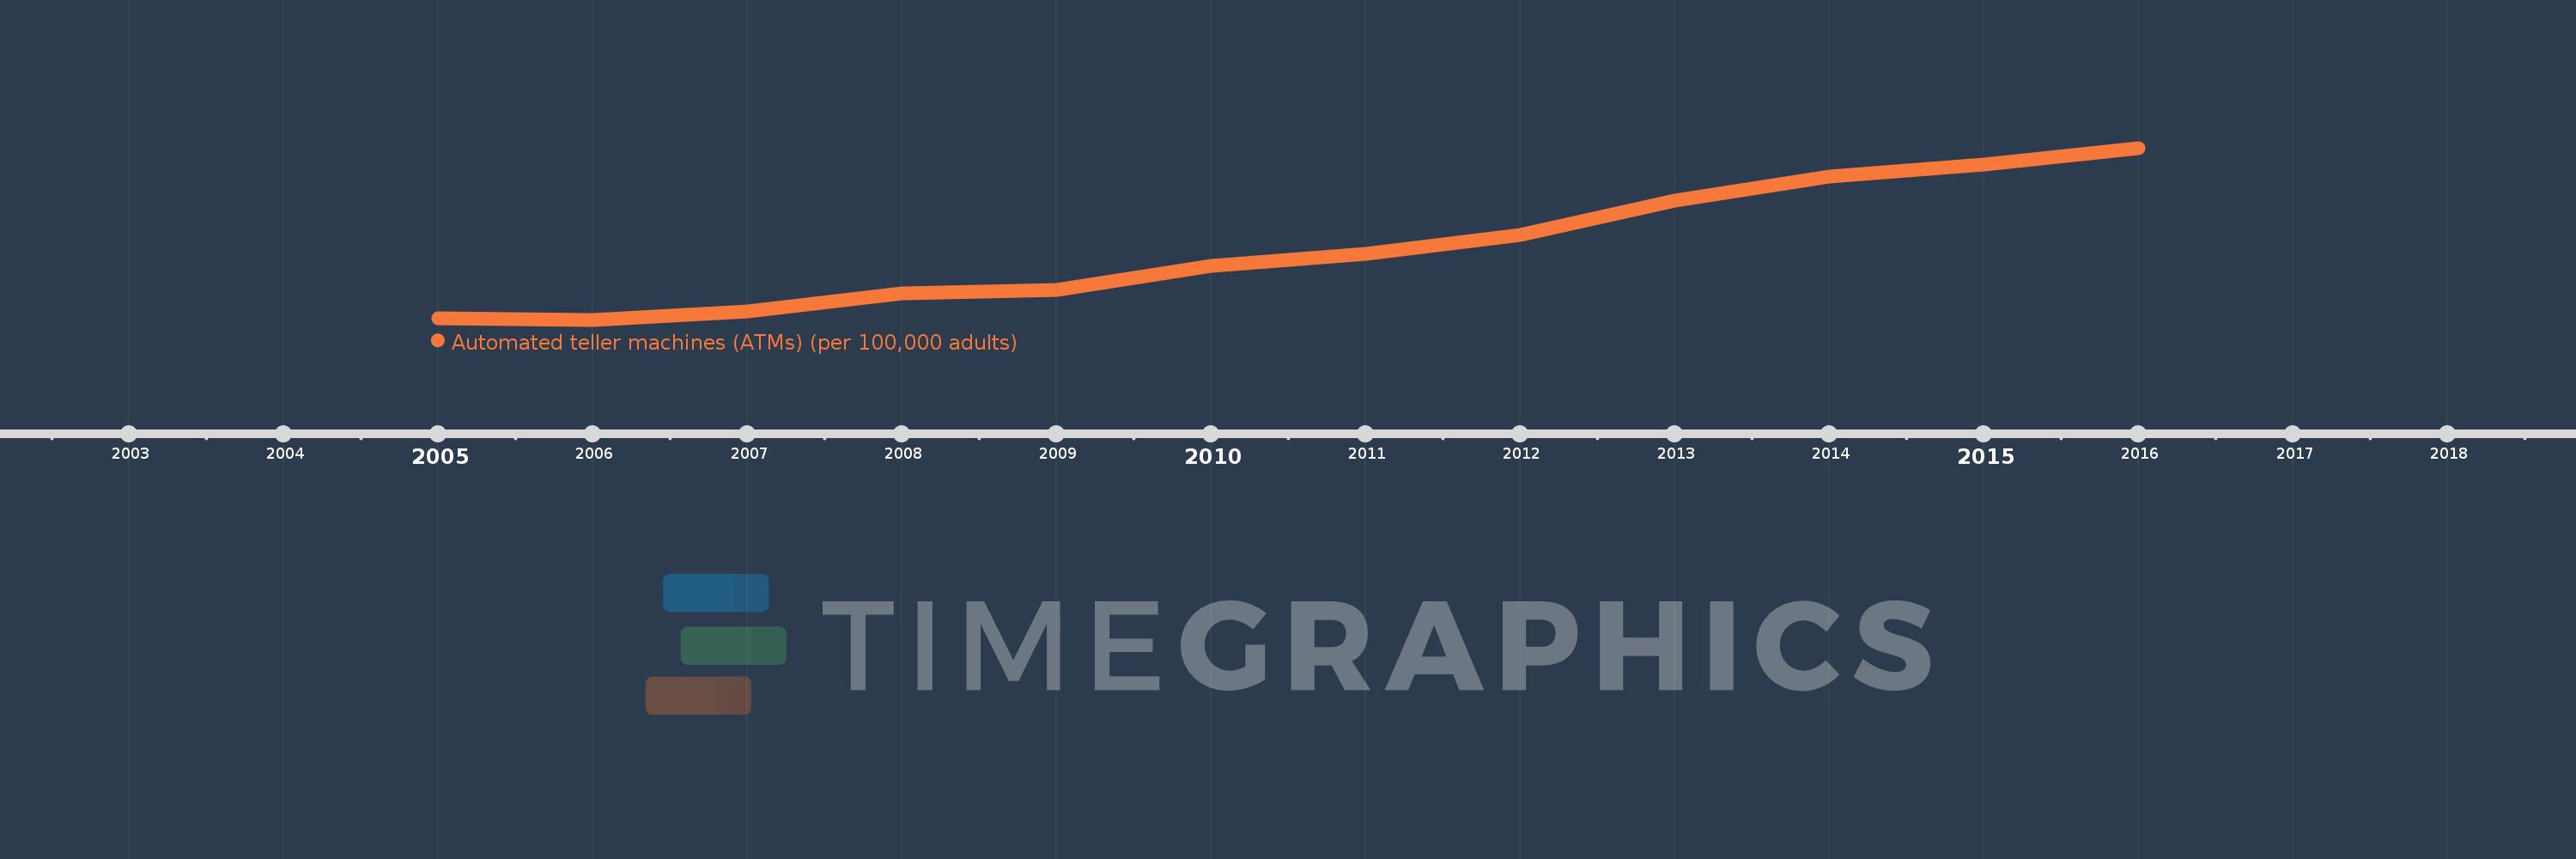
This timeline shows a graph from 2005 to 2016 of East Asia & Pacific (IDA & IBRD countries). No data until 2004. Number of actual observations by date: 12.
Source name:
World Development Indicators
Source organization:
International Monetary Fund, Financial Access Survey.
Categories, topics:
Financial Sector
Last updated:
apr 23, 2017
Indicators value changes by year
Meaning:
15.711
Minimum:
9.327
jan 1, 2006
Maximum:
24.642
jan 1, 2016
At the date of observation
Value
Absolute change
Change from the previous value
jan 1, 2005
9.449
+9.449
0.0%
jan 1, 2006
9.327
-0.122
-1.29%
jan 1, 2007
10.041
+0.714
7.66%
jan 1, 2008
11.693
+1.651
16.45%
jan 1, 2009
11.989
+0.296
2.53%
jan 1, 2010
14.131
+2.142
17.87%
jan 1, 2011
15.17
+1.039
7.35%
jan 1, 2012
16.895
+1.725
11.37%
jan 1, 2013
19.943
+3.048
18.04%
jan 1, 2014
22.097
+2.154
10.8%
jan 1, 2015
23.16
+1.063
4.81%
jan 1, 2016
24.642
+1.482
6.4%
Ranking of countries by current statistics by years
