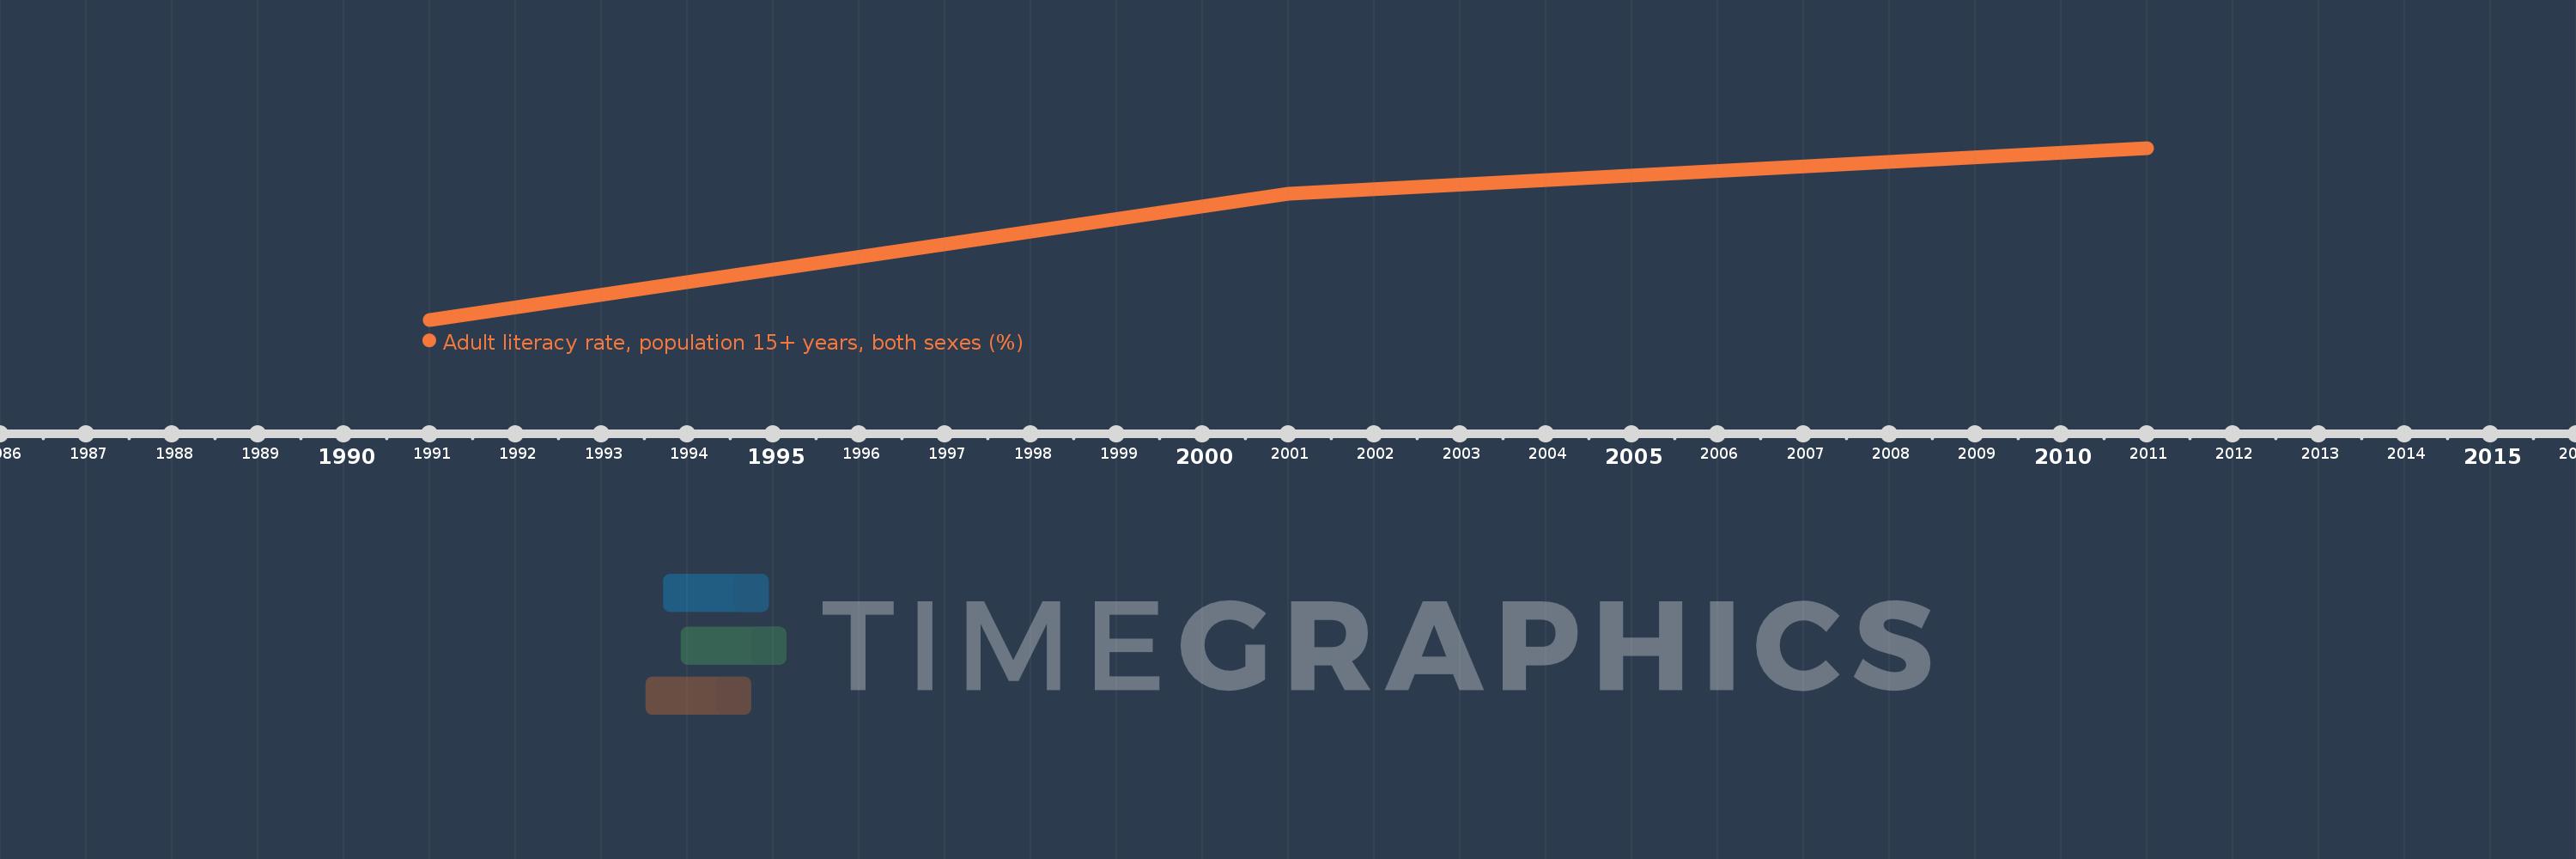
This timeline shows a graph from 1991 to 2011 of East Asia & Pacific (IDA & IBRD countries). No data until 1990. Number of actual observations by date: 3.
Source name:
World Development Indicators
Source organization:
UNESCO Institute for Statistics
Categories, topics:
Education
Last updated:
apr 23, 2017
Indicators value changes by year
Meaning:
88.266
Minimum:
79.459
jan 1, 1991
Maximum:
94.689
jan 1, 2011
At the date of observation
Value
Absolute change
Change from the previous value
jan 1, 1991
79.459
+79.459
0.0%
jan 1, 2001
90.65
+11.191
14.08%
jan 1, 2011
94.689
+4.039
4.46%
Ranking of countries by current statistics by years
