29
/
en
AIzaSyAYiBZKx7MnpbEhh9jyipgxe19OcubqV5w
April 1, 2024
286058
Zambia
ZMB
true
2
1
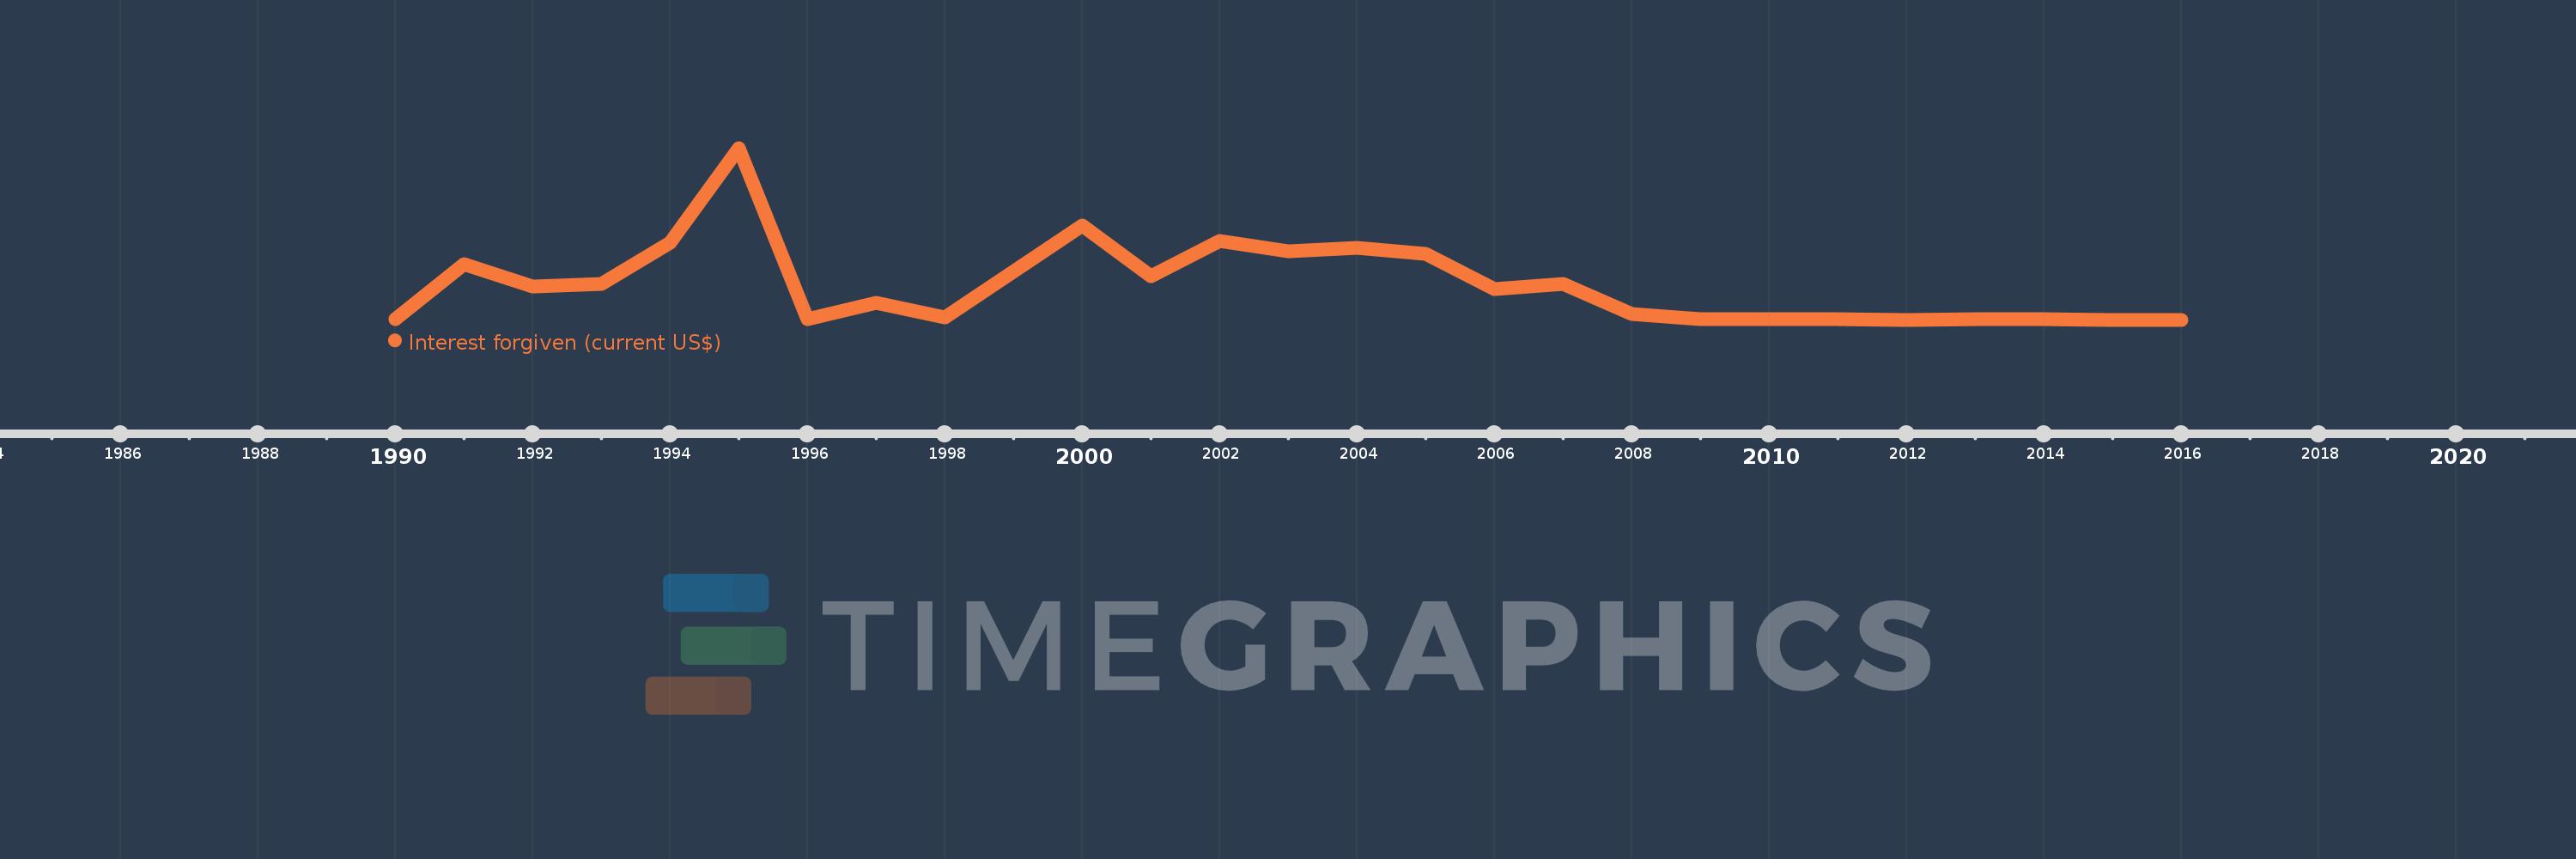
Interest forgiven (current US$)
2016,2015,2014,2013,2012,2011,2010,2009,2008,2007,2006,2005,2004,2003,2002,2001,2000,1998,1997,1996,1995,1994,1993,1992,1991,1990
This statistics in other country:
Timeline:
This timeline shows a graph from 1990 to 2016 of Zambia. No data until 1989. Number of actual observations by date: 26.
Source name:
World Development Indicators
Source organization:
World Bank, International Debt Statistics.
Categories, topics:
External Debt
Last updated:
apr 23, 2017
Indicators value changes by year
Minimum:
437.0K
jan 1, 2012
Maximum:
67.369 mln
jan 1, 1995
At the date of observation
Value
Absolute change
Change from previous value
jan 1, 1990
698.0K
+698.0K
0.0%
jan 1, 1991
22.098 mln
+21.4 mln
3.07K%
jan 1, 1992
13.42 mln
-8.678 mln
-39.27%
jan 1, 1993
14.41 mln
+990.0K
7.38%
jan 1, 1994
30.532 mln
+16.122 mln
111.88%
jan 1, 1995
67.369 mln
+36.837 mln
120.65%
jan 1, 1996
821.0K
-66.548 mln
-98.78%
jan 1, 1997
7.081 mln
+6.26 mln
762.48%
jan 1, 1998
1.387 mln
-5.694 mln
-80.41%
jan 1, 2000
37.228 mln
+35.841 mln
2.58K%
jan 1, 2001
17.571 mln
-19.657 mln
-52.8%
jan 1, 2002
31.182 mln
+13.611 mln
77.46%
jan 1, 2003
27.158 mln
-4.024 mln
-12.9%
jan 1, 2004
28.506 mln
+1.348 mln
4.96%
jan 1, 2005
26.013 mln
-2.493 mln
-8.75%
jan 1, 2006
12.551 mln
-13.462 mln
-51.75%
jan 1, 2007
14.528 mln
+1.977 mln
15.75%
jan 1, 2008
2.688 mln
-11.84 mln
-81.5%
jan 1, 2009
813.0K
-1.875 mln
-69.75%
jan 1, 2010
802.0K
-11.0K
-1.35%
jan 1, 2011
641.0K
-161.0K
-20.07%
jan 1, 2012
437.0K
-204.0K
-31.83%
jan 1, 2013
513.0K
+76.0K
17.39%
jan 1, 2014
659.0K
+146.0K
28.46%
jan 1, 2015
487.0K
-172.0K
-26.1%
jan 1, 2016
494.0K
+7.0K
1.44%
Ranking of countries by current statistics by years


Comments: