30
/
AIzaSyAYiBZKx7MnpbEhh9jyipgxe19OcubqV5w
April 1, 2024
283865
West Bank and Gaza
PSE
true
2
1
Net bilateral aid flows from DAC donors, Belgium (current US$)
2015,2014,2013,2012,2011,2010,2009,2008,2007,2006,2005,2003,2002,2001,2000,1999,1998,1997,1996
Download
Global statistics library →West Bank and Gaza →

Net bilateral aid flows from DAC donors, Belgium (current US$)

This statistics in other country:

AfghanistanAlbaniaAlgeriaAngolaAntigua and BarbudaArab WorldArgentinaArmeniaArubaAzerbaijanBahamas, TheBahrainBangladeshBarbadosBelarusBelizeBeninBhutanBoliviaBosnia and HerzegovinaBotswanaBrazilBritish Virgin IslandsBulgariaBurkina FasoBurundiCabo VerdeCambodiaCameroonCaribbean small statesCentral African RepublicCentral Europe and the BalticsChadChileChinaColombiaComorosCongo, Dem. Rep.Congo, Rep.Costa RicaCote d'IvoireCroatiaCubaCyprusCzech RepublicDjiboutiDominicaDominican RepublicEast Asia & PacificEast Asia & Pacific (excluding high income)East Asia & Pacific (IDA & IBRD countries)EcuadorEgypt, Arab Rep.El SalvadorEquatorial GuineaEritreaEstoniaEthiopiaEuro areaEurope & Central AsiaEurope & Central Asia (excluding high income)Europe & Central Asia (IDA & IBRD countries)European UnionFijiFragile and conflict affected situationsGabonGambia, TheGeorgiaGhanaGrenadaGuatemalaGuineaGuinea-BissauGuyanaHaitiHeavily indebted poor countries (HIPC)High incomeHondurasHong Kong SAR, ChinaHungaryIBRD onlyIDA & IBRD totalIDA blendIDA onlyIDA totalIndiaIndonesiaIran, Islamic Rep.IraqIsraelJamaicaJordanKazakhstanKenyaKorea, Dem. People’s Rep.Korea, Rep.KosovoKuwaitKyrgyz RepublicLao PDRLatin America & Caribbean Latin America & Caribbean (excluding high income)Latin America & the Caribbean (IDA & IBRD countries)LatviaLeast developed countries: UN classificationLebanonLesothoLiberiaLibyaLithuaniaLow & middle incomeLow incomeLower middle incomeMacedonia, FYRMadagascarMalawiMalaysiaMaldivesMaliMaltaMarshall IslandsMauritaniaMauritiusMexicoMiddle East & North AfricaMiddle East & North Africa (excluding high income)Middle East & North Africa (IDA & IBRD countries)Middle incomeMoldovaMongoliaMontenegroMoroccoMozambiqueMyanmarNamibiaNepalNew CaledoniaNicaraguaNigerNigeriaNorthern Mariana IslandsOECD membersOmanOther small statesPacific island small statesPakistanPanamaPapua New GuineaParaguayPeruPhilippinesPolandRomaniaRussian FederationRwandaSamoaSao Tome and PrincipeSaudi ArabiaSenegalSerbiaSeychellesSierra LeoneSingaporeSlovak RepublicSloveniaSmall statesSolomon IslandsSomaliaSouth AfricaSouth AsiaSouth Asia (IDA & IBRD)South SudanSri LankaSt. LuciaSt. Vincent and the GrenadinesSub-Saharan Africa Sub-Saharan Africa (excluding high income)Sub-Saharan Africa (IDA & IBRD countries)SudanSurinameSwazilandSyrian Arab RepublicTajikistanTanzaniaThailandTimor-LesteTogoTongaTrinidad and TobagoTunisiaTurkeyTurkmenistanUgandaUkraineUnited Arab EmiratesUpper middle incomeUruguayUzbekistanVanuatuVenezuela, RBVietnamWest Bank and GazaWorldYemen, Rep.ZambiaZimbabwe

Timeline:

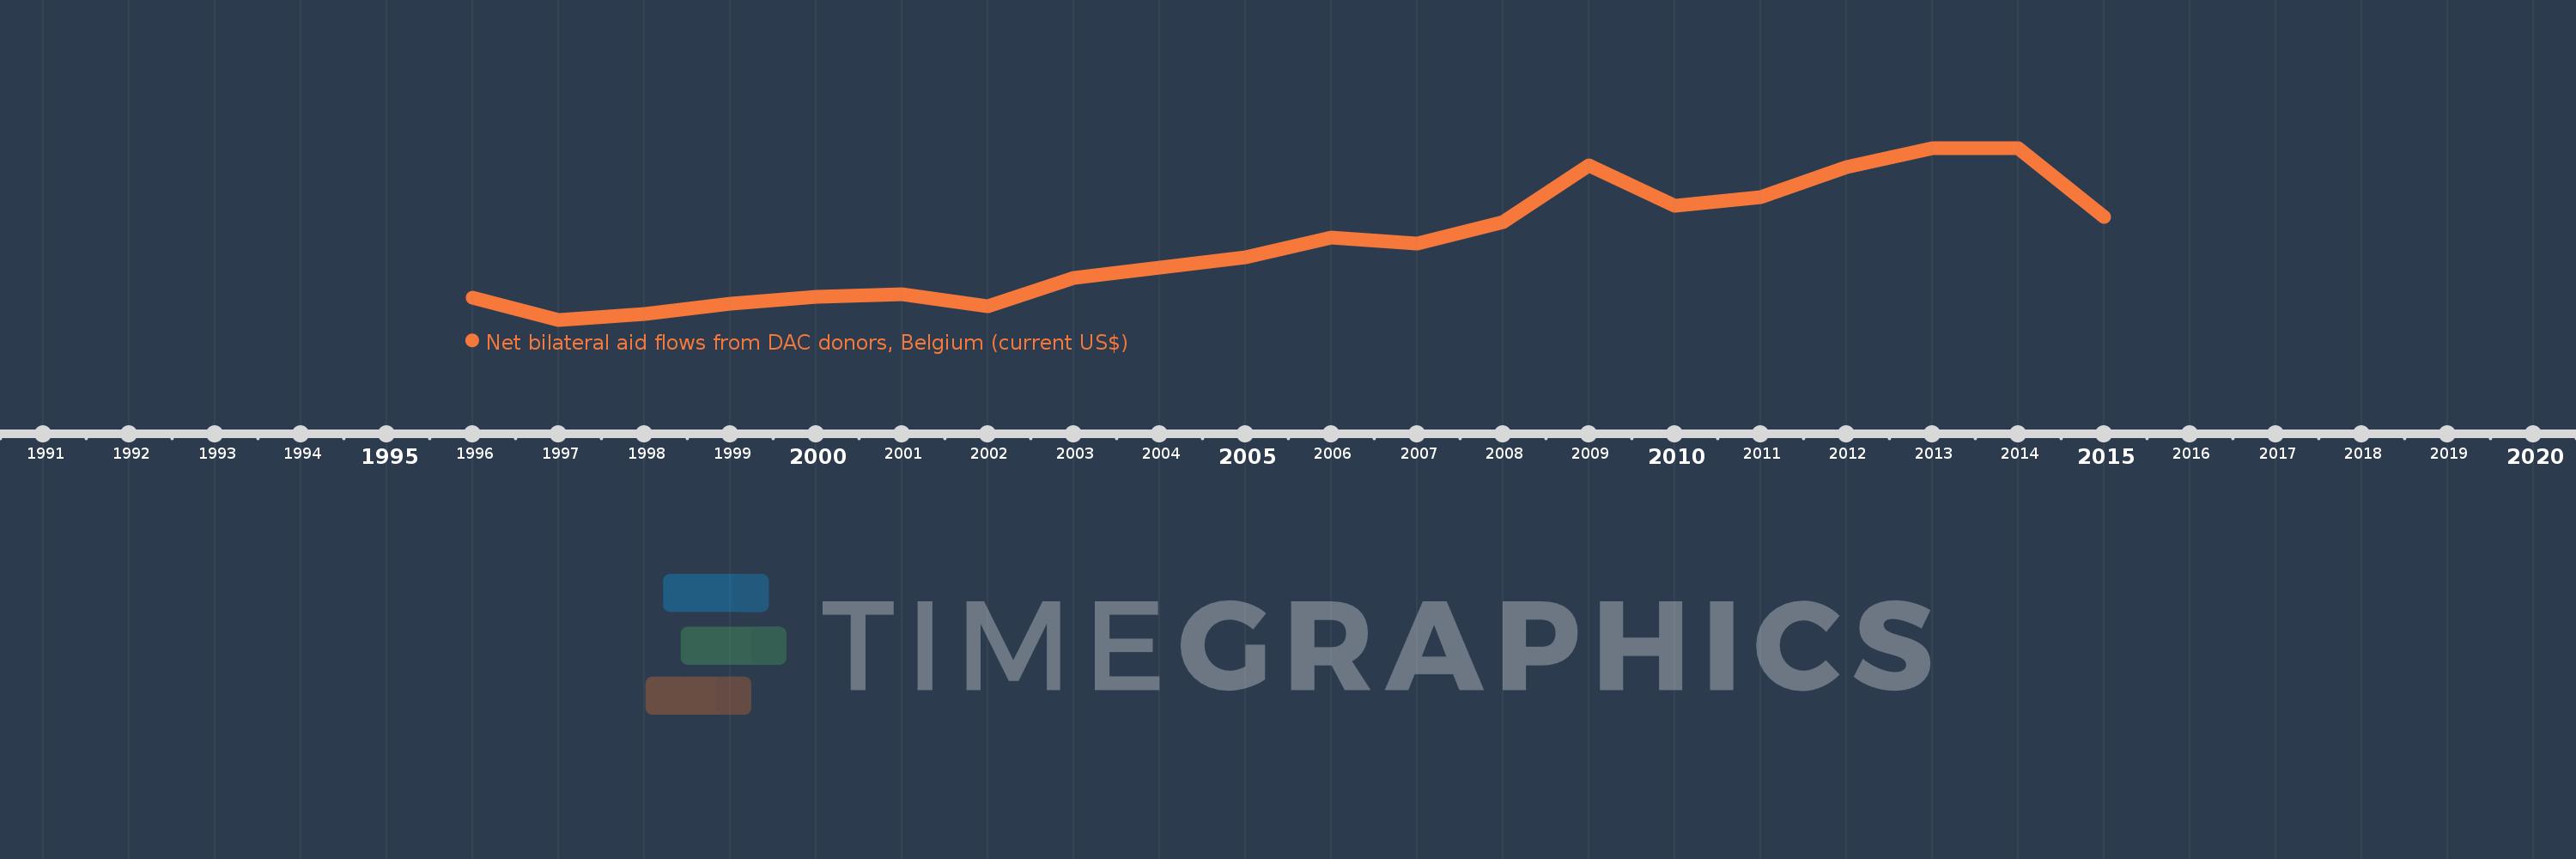
This timeline shows a graph from 1996 to 2015 of West Bank and Gaza. No data until 1995. Number of actual observations by date: 19.

Source name:

World Development Indicators

Source organization:

Development Assistance Committee of the Organisation for Economic Co-operation and Development, Geographical Distribution of Financial Flows to Developing Countries, Development Co-operation Report, and International Development Statistics database. Data are available online at: www.oecd.org/dac/stats/idsonline.

Categories, topics:

Aid Effectiveness

Last updated:

apr 23, 2017

Indicators value changes by year

Meaning:
15.822 mln
Minimum:
1.56 mln
jan 1, 1997
Maximum:
33.54 mln
jan 1, 2014
At the date of observation
Value
Absolute change
Change from the previous value
jan 1, 1996
5.6 mln
+5.6 mln
0.0%
jan 1, 1997
1.56 mln
-4.04 mln
-72.14%
jan 1, 1998
2.65 mln
+1.09 mln
69.87%
jan 1, 1999
4.59 mln
+1.94 mln
73.21%
jan 1, 2000
5.84 mln
+1.25 mln
27.23%
jan 1, 2001
6.31 mln
+470.0K
8.05%
jan 1, 2002
4.01 mln
-2.3 mln
-36.45%
jan 1, 2003
9.41 mln
+5.4 mln
134.66%
jan 1, 2005
13.21 mln
+3.8 mln
40.38%
jan 1, 2006
16.91 mln
+3.7 mln
28.01%
jan 1, 2007
15.75 mln
-1.16 mln
-6.86%
jan 1, 2008
19.74 mln
+3.99 mln
25.33%
jan 1, 2009
30.33 mln
+10.59 mln
53.65%
jan 1, 2010
22.72 mln
-7.61 mln
-25.09%
jan 1, 2011
24.33 mln
+1.61 mln
7.09%
jan 1, 2012
30.01 mln
+5.68 mln
23.35%
jan 1, 2013
33.45 mln
+3.44 mln
11.46%
jan 1, 2014
33.54 mln
+90.0K
0.27%
jan 1, 2015
20.66 mln
-12.88 mln
-38.4%

Ranking of countries by current statistics by years